 In what is likely to be the final preview article for the forthcoming STEM version
8.0, we explore visual connections between individual icons and a related graph, as well as intuitive,
interactive options for adding an element to an existing graph. We also explore
new layout options for pushing a presentation of results in STEM to the web.
Graph links
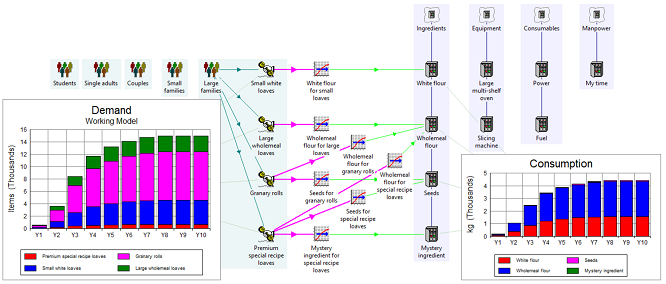
Results are right there in the STEM 8.0 Editor. You can combine icons and related
graphs in the same view, or you can keep your input and output views separate if
you prefer.
This is a cool feature with many intuitive benefits as explained in this
earlier article.

Figure 1: Inputs and outputs combined in a single Editor view
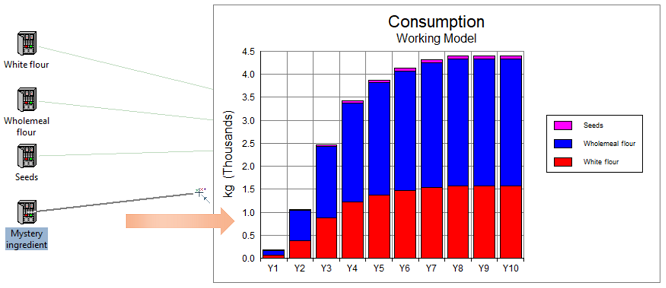
Now you can see if an element and graph are related with optional graph links between
a graph and the associated icons for any elements featured on the graph. Links will
also be displayed for relevant template variants if the graph includes any replicated
elements, and also for contributing resources when cost breakdown results are shown.
Connecting elements to graphs
In STEM 8.0 you can graph results straight from the icon menu for one or more elements.
Now you can add (multiple) elements to an existing graph (or table) as easily as
drag-and-drop onto the graph, or alternatively one at a time with the
Connect tool.

Figure 2: Adding elements to a graph with the Connect
tool or simple drag-and-drop
For elements in a template, you can connect template variants to get a split by
site, and also connect the template itself if you want to include the original total
too.
Since connecting a resource could be ambiguous when cost breakdown is enabled, we
plan to offer a separate cost-breakdown handle
(c.f. the so-called plus handle when connecting
to a transformation) so that you specifically opt-in to requesting the resource
breakdown (as opposed to the more common action of adding the resource as a top-level
element in its own right).
New layout options for eSTEM
With results in the Editor, we have the opportunity to drive an integrated web interface
exported exclusively from the Editor.
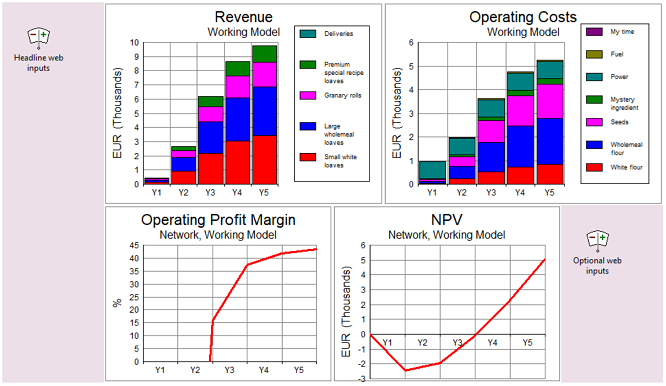
For continuity with existing practice, the input selection will still be driven
from:
- one or more (web-interface) sensitivity elements (either from the current selection
in the Editor or a persistent selection from one export to the next)
- one or more results views
- selected graphs from the current view.
The order of charts/tables will be inferred from the apparent left-right/top-bottom
positions in the Editor, and then positioned with one of the following options:
- n columns
- auto column count inferred from the Editor layout
- WYSIWYG (‘what you see is what you get’), where relative positions/sizes of graphs and tables are scaled to fit the
available width in the web presentation.
By default we will disregard the icons in combined input and results views (icons
and graphs side-by-side) but we will include an option to place inputs in the flat
web output when (web-interface) sensitivities are included in a results view. In
conjunction with the WYSIWYG option mentioned above, this will provide a capability
for mixed input and results presentations that will eventually supersede the present
Compact UI option.

Figure 3: Positioning multiple input controls in a flat web presentation
Keep up to date with the latest techniques and influence the finishing touches
All of this new functionality will be demonstrated and any suggested tweaks discussed
at the forthcoming STEM User Group Meeting in September
2017. Don’t miss it!