A central feature of the forthcoming STEM version 7.0 will be the generation of
allocated Service cost results, broken down by individual originating Resources.
We have been working on a scaleable implementation which is designed to avoid
a combinatorial impact on performance. We provide the drill-down on the latest development
prototype.
Graphing per-Resource costs allocated to a Service
STEM already performs detailed cost-allocation through the calculation framework
for handling incremental demand which is generated when a model is run. Appropriate
shares of Resource costs are routed to the respective Services responsible for used
and slack capacity. However, the 6.2 model engine only stores results for the total
allocations, mainly because costs are already aggregated by intermediate Transformations
before being passed back to Services (though originally also to limit the size of
results files on disk).
In contrast, the new system under development stores separate results for the costs
of each separate Resource which are allocated to a given Service. No changes to
the inputs are required; the model must simply be re-run with the new model engine.
In the matching Results program, we have added two new types of result, ‘Service
/ Resource’ and ‘Transformation / Resource’, for which all the usual cost results
are available, as well as a Used Capacity result which can be used to understand
respective Service shares of the installed capacity of a Resource.
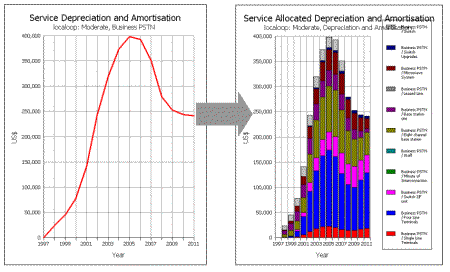
The new system stores separate results for the costs of each separate Resource which
are allocated to a given Service
We have also added some new graph definitions, so for example you can now ask to
draw Service Allocated Depreciation and Amortisation:
- Select Draw from the Graph menu. The Draw Graph dialog is displayed.
- Select Service Allocated Depreciation and Amortisation and click OK (and then select
the desired scenarios if your model has any).
- The Choose Elements to Draw dialog is displayed, listing the Services in the model.
- Select one Service and click OK. A second Choose Elements to Draw dialog is displayed,
this time listing just the Resources for which costs are allocated to this Service.
Click OK to draw the graph.
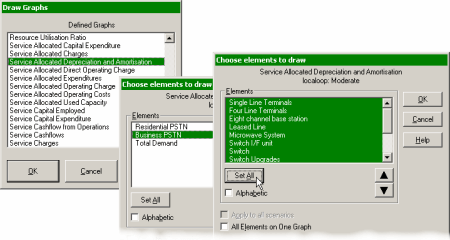
Drawing a graph of Service Allocated Depreciation and Amortisation
The new model engine uses a sparse technique which only generates results for Resources
which do actually contribute costs to a given Service, and we have developed a method
for passing costs through intermediate Transformations which can preserve separation
between originating Resources without a massive increase in computation. Although
disk space has become relatively cheap since early versions of STEM were released,
we will probably make this output optional in the final release so that this overhead
can be avoided.
The product announcement for STEM 7.0 forecasts that “;the generation of allocated
Service cost results, broken down by individual originating Resources, will provide
unprecedented insight into the economics of service provision, highlighting areas
where cost reductions would be most effective”. The filtered selection of Resources
from which to choose these results constitutes a new auditing output, and has already
alerted us to an unintentional allocation of costs in one client model.
Extending the reach of Collections
Experienced STEM users will already be familiar with the use of Collections to provide
automatic sub-total results for arbitrary groups of elements. The names of Collections
of a particular type of element are presented – prefixed with an asterisk – in the
same list as the actual elements of that type when choosing elements to draw for
a graph.
In the context of per-Resource allocated Service costs, the obvious expectation
is that one should be able to use existing Collections of Resources to provide sub-totals
of relevant allocated costs, and this is precisely what has been enabled in our
latest system.
Consider a Service, ‘Business PSTN’, with an indirect requirement for Resources,
‘Leased Line’ and ‘Microwave System’, both of which are linked to a Collection,
‘Backhaul’.
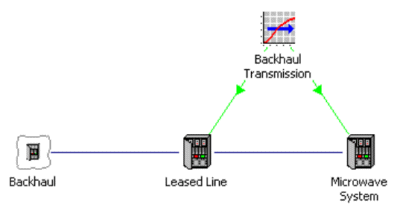
The familiar action is to graph e.g. Depreciation and Amortisation for Backhaul,
and to get the implicit sum of results for Leased Line and Microwave System.
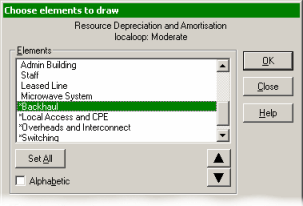
Drawing a graph for a Collection yields aggregate results for the relevant Resources
Now this capability extends down into per-Resource allocated Service results where,
rather than looking at a breakdown of costs from all Resources, you might prefer
to review just a few categories.
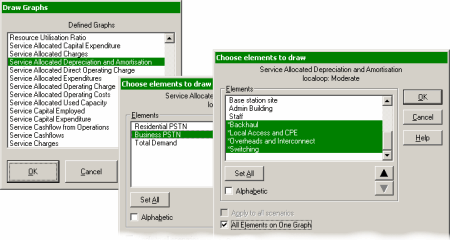
Using Collections to define a categorised breakdown of Resource costs allocated
to a Service
And not forgetting the add-in for Excel!
All of the functionality described in this article has also been extended to the
Excel add-in interface. So the StemGetResult() worksheet function will understand
the following labels:
- Business PSTN / Leased Line
- Business PSTN / Backhaul.
In addition, the usual add-in toolbar buttons can be used to paste lists of all
the valid labels for results of types Service / Resource and Transformation / Resource.