A business model is not an end in itself but a means to simulate the economic performance
of investments. However well calibrated, results are inevitably sensitive to uncertainties
affecting future parameters including competition, demand, cost and technology trends.
The real value of a model is as a bespoke platform for exploring differing outcomes
for a given network solution, and STEM’s integrated scenario engine manages the
process of comparing a consistent set of results across multiple scenarios.
Varying an input across scenarios
Consider a simple wireless local loop model where both market size and network scale
are driven directly by the deployment of base stations. This is typically modelled
with a Location element, representing the base-station roll-out plan, the size of
which will be critical driver for both revenue and cost outputs.
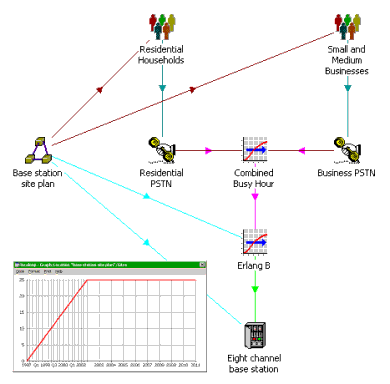
Market size and network scale driven by the deployment of base stations
In order to introduce scenarios for the first time:
- Select the input you wish to modify, in this case the Location Sites input.
- Select Create Scenarios… from the dialog Variants menu.
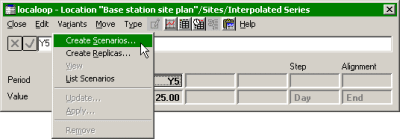
Creating scenarios for the selected input
STEM displays a tabular dialog with three columns for each of the newly created
scenarios, the first row of which is labelled to match the original input, with
the same value copied into each column.
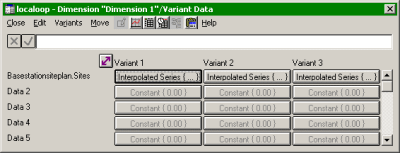
Newly created variant data table
By default, the three scenarios are labelled ‘Variant 1’, ‘Variant 2’ and ‘Variant
3’, and linked via ‘Dimension 1’ (which is explained later). These elements appear
as icons and can be renamed in the usual way, as shown below.
Alternatively, if you de-select Automatic Names from the Options menu, then you
would be prompted for these names as the Variants are created, and before the Variant
Data table is displayed. You would press if perhaps only two Variants were required.
Additional Variants can be created from the toolbar, or from the Edit menu in the
Variant Data dialog.
In this example, we shall name the Variants ‘Slow’, ‘Moderate’ and ‘Fast’, and then
enter roll-out periods of ten, five and two years respectively.
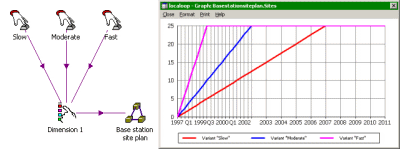
Slow, Moderate and Fast roll-out compared
This simple structure provides a concise description of the scenario space, and
the full results set can generated with a single command in the Editor:
- Select Scenarios… from the File menu. The Scenarios dialog is displayed.
- Click Save and Run All.
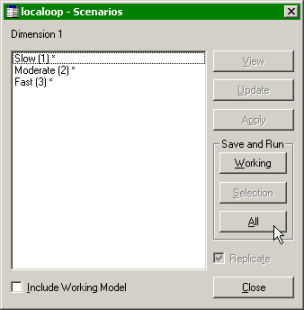
Running scenarios
The appropriate Variant Data are pasted into three parallel, generated copies of
the model which are immediately run in sequence. The Results program then offers
a selection from these three scenarios when you draw any graph so that, for example,
you can compare the NPV between the three scenarios.
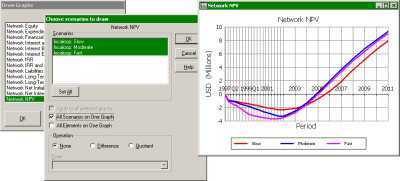
Comparing NPV across multiple scenarios
Varying another input with the first
The Slow roll-out is easy on investment but weak on customer acquisition. In order
to address this shortcoming, the operator might offer an introductory tariff discount
for the early years, but only in the Slow scenario.
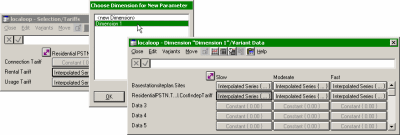
The same procedure is used to identify Service Rental Tariff as a parameter for
these scenarios, and this time STEM asks you to choose a Dimension for this new
parameter. We select the existing Dimension 1 because the tariff is correlated with
the roll-out, and so the tariff input is added to the second row of the existing
Variant Data table.
Adding an extra Dimension parameter
Varying uncorrelated inputs
Another angle you might wish to explore would be sensitivity to variations in cost,
independent of the Roll Out scenarios described above. When you create these scenarios,
select, so that the cost variants become the first row of a new table.
Now you can see the significance of the Dimension element as a descriptor for each
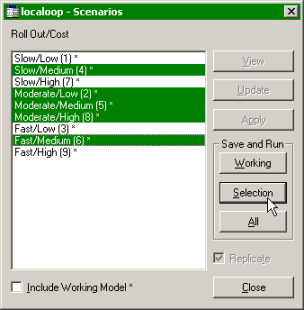
correlated set of input variants. Thus we might rename Dimension 1 as ‘Roll Out’
and Dimension 2 as ‘Cost’, with new variants ‘Low’, ‘Medium’ and ‘High’.
When you come to run scenarios, STEM will have generated 3 × 3 = 9 possible combinations,
with labels such as ‘Moderate / Medium’. You can maintain a selection of the particular
scenarios of most frequent interest for comparison, the results for which can be
generated with the Run Selection button.
Running a selection of scenarios
Technology variants
One common question is whether different structures can be compared with scenarios.
The answer is a firm yes! The standard approach is to use separate Multiplier Transformations
to drive the different technologies, and then to create ‘one/zero’ scenarios for
the multiplier inputs in order to route demand to the appropriate elements.
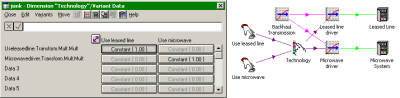
Comparing technologies using scenarios
Note: if there are just two technologies, it is more concise to drive only the first
multiplier as a variant, with an invariant complementary formula for the second
multiplier.
Behind the scenes
Of course the Dimension element is more than just a label. As well as grouping the
relevant Variant elements, it also identifies the respective input parameters which
will be replaced with Variant Data when scenarios are generated. Dimension parameters
can be accessed directly from the Dimension icon menu:
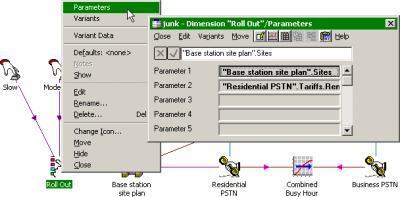
The Dimension Parameters dialog
If you prefer, additional parameters can be defined by editing one of these parameters
and then clicking on the desired input – see Internal references and reference mode
in the Essential STEM Editor Skills section of the STEM User Guide. The original
value of this input will be copied to all variants for the new parameter.
Parameter references can be removed from the Parameters dialog, or more commonly
from the original input data dialog, by selecting Remove from the dialog Variants
menu.