 Software
development, like any product development process, requires attention on many levels.
First of all there is routine maintenance, where minor improvements are made and
the occasional bug fixed. And then there are regular upgrades, where new features
are added to an existing product platform. In the background, you keep an eye on
the market and listen to your customers’ feedback, developing a picture of a new
product beyind the scope of whatever upgrades you might make to the current vehicle.
Software
development, like any product development process, requires attention on many levels.
First of all there is routine maintenance, where minor improvements are made and
the occasional bug fixed. And then there are regular upgrades, where new features
are added to an existing product platform. In the background, you keep an eye on
the market and listen to your customers’ feedback, developing a picture of a new
product beyind the scope of whatever upgrades you might make to the current vehicle.
So our recent feature review has identified some fundamental attributes of STEM
which we propose to review in a STEM version 8.0, tentatively scheduled for release
in April 2009. First of all, we will re-design the underlying data model for STEM
to allow a wider range of drivers, in principle an anything-drives-anything model.
In parallel, we propose a wide-ranging review of the Editor interface, focusing
on usability and flexibility, in conjunction with a complete re-working of the results
selection logic for graphs. We will also further update the service model to accommodate
traffic profiles and priority classes.
If I can think it, then do it!
Due to the way the current STEM model has evolved, there is significant diversity
in the way that relationships between elements are captured. For the user (and especially
the novice), this translates into puzzling inconsistencies about how things work
and what can and cannot be done.
For example, I can link two Transformations together in a chain, converting from
voice Erlangs to channels to bandwidth with two separate multipliers; whereas I
cannot link two Market Segments together, except by writing a formula. And I can’t
drive one Resource from another without creating an intermediate Transformation.
It would be more intuitive for anything to be able to drive anything (as far as
possible), and for STEM to automate the actual calculations, as it does for the
current specific relationship types.
We have determined that rationalising this data-model diversity is actually the
key to being able to create truly ‘re-useable templates’, i.e. model fragments which
could be wrapped up with a formal interface of inputs and outputs and then wired
up directly in other models as an icon. This approach would be far more flexible
and intuitive than the current template replication model (where you essentially
have to anticipate and parameterise all possible relationships in advance).
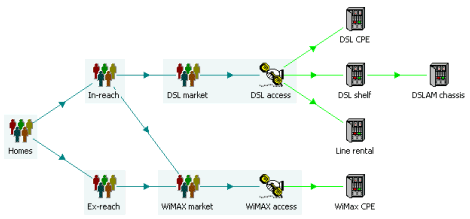
Directly linked Market Segments and Resources
We may also change the default basis for links between Services and Resources, and
for Transformation inputs, to be ‘none’, so that you would be forced to make an
explicit choice when linking these elements. This would rule out a current source
of errors where the silent default is simply inappropriate.
Traffic profiles and service priority classes
And if that all sounds rather generic and cerebral, then more concretely, we also
aim to add further sophistication to the modelling of traffic. For all service types,
we will add 24-hour traffic profiles as an option for aggregating busy-hour traffic
across multiple services. In fact we may re-visit the terminology to replace busy
hour with busy period. In the data world, five minutes may be a more appropriate
sampling period for peak dimensioning, so Prop. of Traffic in Busy Hour may become
Prop. of Traffic in Busy Period, and we may reduce Annual to Busy-Hour Unit Ratio
simply to Traffic Unit Ratio.
For data services in particular, we hope to be able to implement QoS classes which
will capture to an order of magnitude the extent to which low-priority services
such as email and Web browsing may piggyback on slack capacity over time from higher-priority
services like VoIP.
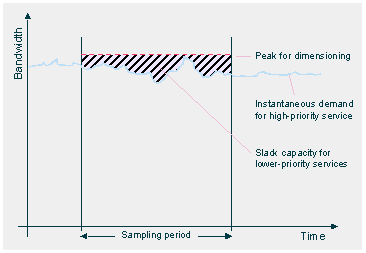
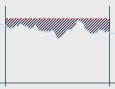
Slack capacity for lower-priority services
New-look streamlined Editor interface
We have received a multitude of comments about the interface for data entry in STEM,
mostly focused around how it differs from Excel. Our challenge is to assess these
differing opinions and then to conceive an improved design which will win more widespread
support and not just introduce further confusion. Details which we will consider
range from the overall presentation style, possible use of tabbed dialogs and so
on, through to the microscopic details like how to select fields, how to access
time-series parameters, and whether you should need to press <Enter> before
moving to another edit.
The position of data dialogs may be saved so that they would be restored on opening
a model, and possibly even when switching views, and also preserved after an undo.
The user should be given more control over the order of elements in tables in the
Editor, and have the option to sort the names alphabetically. We may also rationalise
the use of names and labels, e.g. to allow an element’s ‘name’ to be part of its
data and linked from Excel (although this functionality would be removed for run-time
models). If distinct labels are retained, then they need to be adjusted for template
replication in the same way that replicated names are currently qualified with individual
variant names (‘Service 1’ becomes ‘Service 1 / Variant 1’).
In similar vein, it should be possible to re-order user data, and to insert additional
rows.
Finally, we are receiving requests for alternative logistic models, annual growth
models, cubic splines, and so on, and so we will extend the existing range of time-series
types (alternative parameterisations, such as S-Curve and Interpolated Series),
and possibly allow the user to add their own formulations.
Various annual-growth models
Since the ‘time-series’ is also used as our generic data type for scenario and template
variant data, we may add other non-time-series types in order to facilitate the
direct definition of variants for inputs such as Price Lists, Input-Output Mappings
and Transformation Inputs. (At present such alternatives must be coded indirectly
using parallel Multiplier Transformations to enable the desired variant.)
Accelerated results selection and development
Following the introduction of snapshot and tornado charts into the STEM 7.1 Results
program, we are not planning any significant changes to the results interface in
7.2 (instead focusing on the new export of model results to Excel). However, it
is already clear that the results selection logic could be radically improved in
two specific dimensions.
First of all, the user is currently overloaded with an enormous and hard-to-navigate
selection of charts and results. The selection process could be improved with a
hierarchical selection of charts (by element type), and simplified with tabs for
user-defined favourite graphs and most-recently-selected charts. Selecting the elements
first would also reduce the number of graphs to choose from. Options such as the
graph format and showing as a table should also be accessible when selecting a pre-defined
graph to draw, as they are with the current Draw New command (if only as a button
in one of the dialogs).
Secondly, it should be possible to modify the selections of scenarios, elements
and results on an existing chart, and also to ‘clone’ new charts from an existing
chart as a better starting point than going back to the general lists. The current
chain of ‘model’ dialogs used to draw a graph could be replaced with persistent,
floating windows defining the current default selections. Any individual chart would
then provide an alternative set of selections to the current floating lists.
Floating selections for an existing chart
Both of these enhancements would radically simplify the process of creating charts
in STEM, and simultaneously accelerate the process of selecting results for export.
We might also refine the results ‘view’ concept, adding a New View command and options
to update views automatically as you switch between them, to avoid ‘losing’ graphs
which you have drawn but not explicitly fixed into the current view. Finally, if
we adopt ‘tabbed dialogs’ for data entry in the Editor, then it would be consistent
to use the same visual device for both Editor and Results views. This would make
the existence of views more evident to fellow workers, and also provide a single-click
interface to any view.
An obvious next step would be to integrate both types of view into a common application
interface, but that might just be too radical for STEM 8.0.
A picture of success
We are ‘thinking out loud’ and value your input
Like the preceding article outlining
features for STEM 7.2, the ideas set out above are only indicative of our
current thinking and may differ from what we decide to do later. The intention again
is to share our ideas at the earliest stage in order to stimulate further discussion,
and to gain feedback from our customers on the overall directions indicated.
You can discuss these topics with us directly at the STEM User Group Meeting, 19–20
September 2007 at Corpus Christi college in Cambridge, UK.