The headline features of STEM version 7.2 are mostly complete. The principal objective is to make the software easier to learn and to
hand over to colleagues.
Effort is now focusing on rounding out some grey areas of the specification and
generally smartening up the user experience prior to release to customers. A beta-test programme will be available in due course for dedicated users who are
keen to influence the functionality of the final release. Please contact us
if you would like to participate.
‘Click and click again’ toolbar and simplified linking
The toolbar no longer drops icons at the bottom left of the screen, but waits for
a second click so that you can position the new icon directly where you want it. The snap-to-grid function will still keep your icons nicely arranged (unless you
override it with the <Alt> key), and this also now applies when elements are
copied and pasted.
A new ‘data link’ button enabled you to link elements by clicking this button on
the toolbar and then dragging a linking line from one element to the other. This process is more intuitive, and does not require any special knowledge, compared
to the existing ‘expert’ technique of dragging between elements with the <Ctrl>
key pressed.
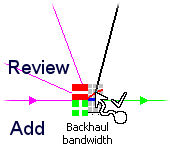 The
‘drop’ interface for Transformations has been simplified to allow the type to be
changed to the more flexible Expression type on demand. New dynamic graphical
‘targets’ on the icon allow you to choose between reviewing an existing input or
linking directly to the next free input.
The
‘drop’ interface for Transformations has been simplified to allow the type to be
changed to the more flexible Expression type on demand. New dynamic graphical
‘targets’ on the icon allow you to choose between reviewing an existing input or
linking directly to the next free input.
You can also now drag-and-drop a multiple selection of services (or transformations)
onto a resource to create multiple requirements in one go and save time when setting
up large models.
Free text in views
If you are already familiar with STEM, then the icon names and automatic links make
a model almost self-documenting. But if you are not, then a few concise notes in
the relevant areas of a view, or attached to the icons, will make it much easier
for someone to follow your ideas, and more immediately apparent than the existing
notes on the embedded data. Text boxes on a view can make it more immediately
apparent, and easier to explain to colleagues, how a STEM model works.
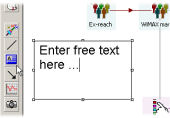 You
click another new button on the toolbar, and then click and drag to mark out a new
text area, into which you can then type titles, group headings or explanatory notes. You can choose left, right or centre alignment for the text, and optionally have
the height of the box expand automatically to fit the text.
You
click another new button on the toolbar, and then click and drag to mark out a new
text area, into which you can then type titles, group headings or explanatory notes. You can choose left, right or centre alignment for the text, and optionally have
the height of the box expand automatically to fit the text.
These text fields are not rich text, in the sense that you cannot format
individual characters; but you can set the typeface (font), size and colour for
all the text in any one box, with the option to apply the changes to all text boxes
in a view, and to set the default attributes for newly-created text boxes. You can also set an optional background colour and choose the colour and thickness
of an optional box outline.
Results export wizard for Excel
To match the ‘export model data’ command available in STEM 7.1, we have now implemented
an intuitive export process to get data from STEM results graphs to Excel in just
a few clicks. You can ask STEM to create an Excel workbook containing all
the data from a chart in the STEM results program, or from all the charts in the
current view, or from selected views in the current workspace. The familiar graph
selection interface is used as the wizard element for selecting data to send to
Excel.
Exporting STEM model results to Excel
The generated Excel sheets link their data dynamically from STEM (using the STEM
add-in toolbar for Excel) so that they can be updated automatically after you re-run
the underlying model.
All the data from a given view is written to a single worksheet with the same name
as the view, and you have the option to choose separate sheets when exporting multiple
views. STEM offers to write subsequent exports onto new sheets in a previous export
workbook if you so wish.
Developing this functionality for results made us look again at the export of model
data in STEM 7.1 and we have now added some extra formatting options for exported
inputs to make Excel input sheets easier to read and more reminiscent of the layout
in STEM.
Additional enhancements
Sometimes the small details can be just as import as the headline features and a
long list of minor refinements will be documented in the final release notes for
STEM 7.2. The following items may be of particular interest:
- a new ‘average connections’ basis is provided for service requirements, and for
service inputs to transformations, which is useful for modelling operating costs,
especially for declining services where the end-of period demand is under-representative
of the average load on resources
- the status bar in the editor will flash to draw attention to detailed error messages
when a model is checked, and will highlight the text of such messages more clearly
- new pre-defined results are generated for the net present value of resource costs,
and also for the number of any early-decommissioned units.
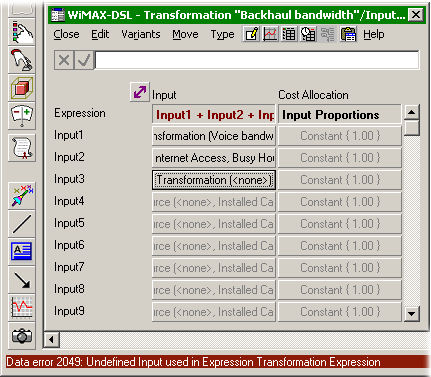
Status bar highlighting for error messages