The latest STEM version 7.2 was released to licensed users on 14 October 2009, with
a number of new features designed to make the software more intuitive to learn and
easier to use day-to-day by targeting known barriers to acceptance. Current licensees
with an active website subscription can download the new version directly.
Please note that, for compatibility reasons, we will not change your soft-licence
credentials until you signal your intention to start working with the new version.
(If you have been using STEM 7.1 then you will need to load and install STEM 7.1d to keep working with both versions
in parallel.) Prospective customers and existing users of older versions of STEM
should contact Implied Logic
to arrange access to the new version.
The formal launch at the STEM User Group Meeting at the end of September in Cambridge,
UK followed a period of beta testing in which a number of unexpected issues were
resolved or refined. The feature set was finalised for the User Group event, and
a few issues raised by delegates have been addressed prior to final release.
STEM 7.2 overview
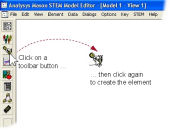
A re-designed Click and click again toolbar allows newly created model
elements to be positioned directly by moving the cursor and then clicking again.
 A
new Connection tool provides a more intuitive and visual method of linking
elements (rather than the obscure Ctrl-drag-and-drop method), coupled with a simpler interface
for connecting Transformation inputs.
A
new Connection tool provides a more intuitive and visual method of linking
elements (rather than the obscure Ctrl-drag-and-drop method), coupled with a simpler interface
for connecting Transformation inputs.
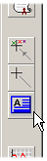
A new Text Box tool allows you to add headings and explanatory notes alongside
the icons in a view (‘free text in views’), making the principles of a model more
evident to colleagues and clients.
A new Results export wizard enables you to link STEM results data into
Excel charts with just a few clicks, creating an Excel workbook from the data in
selected charts or results views in STEM.
A new Auto-column format option (for new charts of aggregate results such
as traffic volume, revenue, capex and opex) overrides the standard line format with
overlapping columns (for multiple scenarios, results or elements) or stacked columns
(for one result over multiple elements).
This STEM 7.2 release is fully compatible with models created in version 7.1, but
models saved with STEM 7.2 cannot be read by STEM 7.1 or earlier versions.
‘Click and click again’ toolbar
 The
original STEM toolbar would automatically position the icon for a new element at
the bottom left of the screen – you then had to drag it into position. In contrast,
the toolbar in STEM 7.2 now has a more intuitive ‘click and click again’ operation.
The
original STEM toolbar would automatically position the icon for a new element at
the bottom left of the screen – you then had to drag it into position. In contrast,
the toolbar in STEM 7.2 now has a more intuitive ‘click and click again’ operation.
New icons will ‘snap-to-grid’ unless you press <Alt>, and this also now applies
when elements are copied with drag-and-drop or pasted.
|
Method
|
Location of new icon
|
|
Click the toolbar, and then click again
|
Mouse cursor (subject to snap-to-grid)
|
|
Select Create from the element menu, and then click again
|
Mouse cursor (subject to snap-to-grid)
|
|
Click the toolbar while pressing the <Shift> key
|
First available slot (along and up) from the bottom left
|
|
Press <Ctrl+Shift+S> to create a new Service (and so on)
|
Ditto: useful if you want to create several elements at once
|
|
And implicitly when you create a new scenario Dimension
|
First available slot large enough for the Dimension and Variants
|
Four ways to create an element
New tool for connecting elements
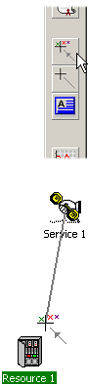 A
new Connection tool provides a more intuitive and visual way to connect two elements
than the original technique which used drag-and-drop with the <Ctrl> key.
The mouse cursor reflects the wand image from the new tool, and you simply click
the two intended elements in turn in order to connect them.
A
new Connection tool provides a more intuitive and visual way to connect two elements
than the original technique which used drag-and-drop with the <Ctrl> key.
The mouse cursor reflects the wand image from the new tool, and you simply click
the two intended elements in turn in order to connect them.
As you move the cursor over potential target elements, the icons are highlighted
to ease accurate selection.
Note: the old technique still works, and with the benefit of target highlighting;
but it is non-intuitive for new users. Experienced users will be pleased to note
that there is no longer a ‘hole’ between an icon and its caption, and this reduces
the risk of accidentally creating a copy of an element when using the Ctrl-drag-and-drop
method.
You can also select Connect from the element menu to activate the connection cursor,
or just press <Ctrl+Q>. The latter method avoids excessive mouse movement,
just like the original drag-and-drop technique.
A ‘Link from Selected element’ option causes the tool to connect automatically from
the currently selected icon if you prefer to select the icon first and then connect.
Connecting two or more Transformation inputs
In previous versions of STEM, a Transformation element had to be explicitly changed
to the Expression type before it could accept multiple inputs. STEM 7.2 provides
a new interface for dragging additional inputs which makes this change implicit
and automates selection of the next free input slot.
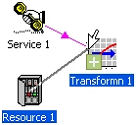 If
you connect one input to a Transformation, you will get a simple Multiplier Transformation
as usual; but now when you connect another input, a new ‘add’ handle appears at
the bottom left of the Transformation icon. Connecting to the add handle results
in an additional input, and the Transformation becomes an Expression Transformation
(if not already).
If
you connect one input to a Transformation, you will get a simple Multiplier Transformation
as usual; but now when you connect another input, a new ‘add’ handle appears at
the bottom left of the Transformation icon. Connecting to the add handle results
in an additional input, and the Transformation becomes an Expression Transformation
(if not already).
Note: STEM prompts if you have already entered some data for the multiplier input
of a Multiplier Transformation which would be discarded by the implicit change of
type to Expression.
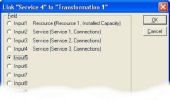 Connecting
instead to the icon background pops up the input-selection dialog as before, so
you can ‘re-wire’ one of the existing inputs, or choose another free one. The current
inputs are now clearly labelled in the dialog. However, the dialog is not shown
if you drag onto the background of a Multiplier Transformation: its single input
is simply replaced and it remains a Multiplier.
Connecting
instead to the icon background pops up the input-selection dialog as before, so
you can ‘re-wire’ one of the existing inputs, or choose another free one. The current
inputs are now clearly labelled in the dialog. However, the dialog is not shown
if you drag onto the background of a Multiplier Transformation: its single input
is simply replaced and it remains a Multiplier.
Note: for simplicity, it is no longer necessary to hold down <Shift> to connect
one Transformation to another.
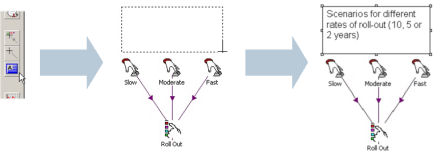
Free text in views
 If
you are a STEM user, then the icon names and automatic links make a model almost
self-documenting; but what if you are not familiar with the system? STEM 7.2 has
a new Text Box button on the toolbar which allows you to add titles, group headings
or explanatory notes to a view, making it clearer at a high level how the key parts
of a model fit together.
If
you are a STEM user, then the icon names and automatic links make a model almost
self-documenting; but what if you are not familiar with the system? STEM 7.2 has
a new Text Box button on the toolbar which allows you to add titles, group headings
or explanatory notes to a view, making it clearer at a high level how the key parts
of a model fit together.
STEM’s existing notes are analogous to cell-wise comments in Excel, whereas text
boxes are much more immediate and are not buried in the model data, more like a
‘Post-It’ (or a comment in PowerPoint).
The creation process is designed to match expectations from using Office applications.
So you just click the Text Box tool once, click and drag to outline the intended
rectangle, and then enter suitable text as desired. The height of the new text box
matches the number of lines of text entered, regardless of the initial ‘rubber-band’
area.
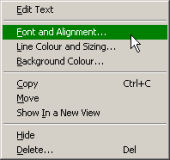 You
can modify the font, alignment, border and background of text boxes. The relevant
dialogs are accessed by right-clicking the text box border to select from a context
menu. When changing any of these settings, you can optionally: apply a format to
all other text boxes in the same view, and/or set this format as the default for
any newly created text boxes in the same view.
You
can modify the font, alignment, border and background of text boxes. The relevant
dialogs are accessed by right-clicking the text box border to select from a context
menu. When changing any of these settings, you can optionally: apply a format to
all other text boxes in the same view, and/or set this format as the default for
any newly created text boxes in the same view.
Note: formatting (e.g., bold) is applied to the whole text, not individual words
or characters.
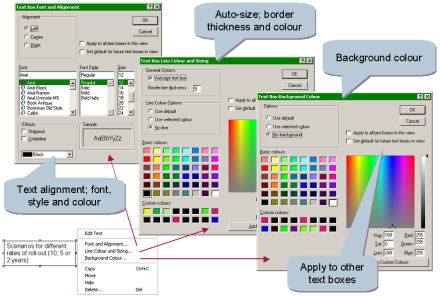
Text box formatting dialogs
Results export wizard for Excel
STEM 7.1 provided the facility to export selected STEM model input data to a companion
Excel workbook. STEM 7.2 now builds on this with the export of STEM results data
from selected charts or results views. In both cases the data can be linked dynamically:
inputs defined in Excel link through to the model, and results shown in Excel are
updated after a model run.
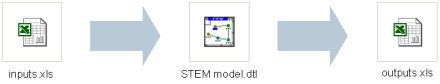
Model inputs and results linked between Excel and STEM
The usual Results program graph-selection interface is the ‘wizard’ for pre-selecting
the data to send to Excel. You first draw graphs of the data you wish to export,
or open a pre-defined view of suitable results; and then select Export Results to
Excel from the File menu.
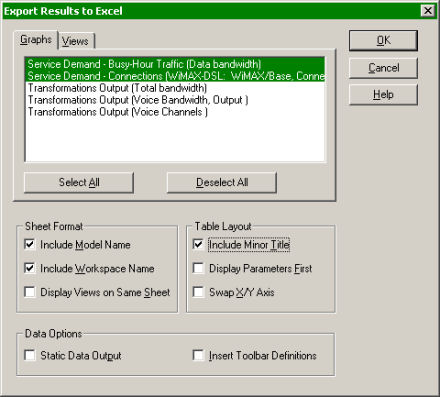
STEM exports the data to a new sheet (or sheets) of a workbook in the same folder
as the model, and displays the workbook when complete.
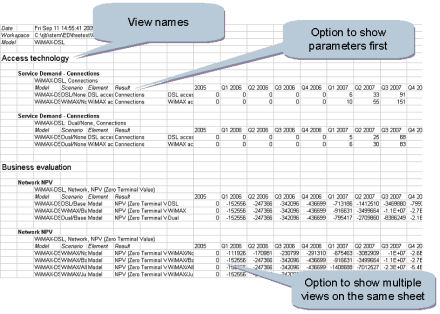
Specimen export output (views)
Auto-column format option
STEM graphs have always had a line format by default for maximum readability with
respect to potential combinations of multiple scenarios, elements and results. However,
while a line format suits instantaneous results such as penetration or installed
capacity, a column format is generally preferable for discrete, aggregate quantities
such as traffic volume, revenue, capex and opex.
STEM 7.2 adds an option to auto-select a column format for new charts of such aggregate
results, using overlapping columns for multiple scenarios, or models, or elements,
up to a limit of four series, or stacked columns for one result over multiple
elements. (One doesn’t generally expect to sum over separate scenarios, or models.)
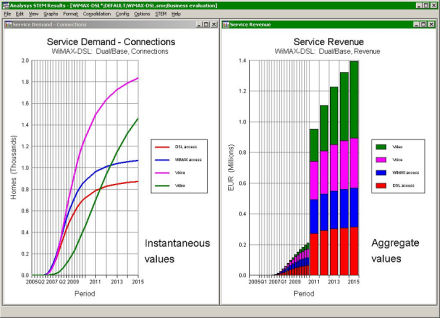
Instantaneous and aggregate values
Miscellaneous additions
Myriad changes and minor improvements have been made along the development path
since STEM 7.1 was released in 2007. A few of the more significant details are noted
below.
- A new ‘Average connections’ basis is available for Service Requirements and Service
inputs to Transformations
- A top-level ‘note’ can be added to an element directly from the icon menu – previously
this item was greyed out until a note was actually defined
- Parameter validation errors are now highlighted in the status bar
- The Windows context menu key now activates icon menus
-
Menus show <Ctrl+C> rather than <Ctrl+Insert> – both key combinations
are supported
|
|
- New pre-defined results are generated for the net present value of Resource costs,
and also for the number of any early-decommissioned units
- The Choose element to Draw dialog uses more of the screen if there are very many
elements
- STEM 7.2 has a brand-new and conventional wizard-driven installer which should be
more readily accepted by IT staff
|
The single, overriding objective for STEM 7.2 was to make the software easier to
learn. STEM has evolved a very rich set of functionality, but historically ease
of use has mostly been a secondary design consideration behind functional output.
‘Road blocks’ for new users have been explained via training and support, but not
actually addressed.
By adding new features and targeting known barriers, we have made STEM 7.2 easier
to learn, and then to use, to hand over, and to package with Excel.