This latest technical article examines our response to a typical (and recent) modelling support request. An x% uplift on the cost of certain capital assets is modelled in the surrogate context of a business case for VoIP over air.
This article demonstrates our close and flexible working relationship with customers.
Here the modeller wished to apply a consistent treatment to capture tax on the sale
of goods, which essentially materialises as an x% uplift on the cost of certain
capital assets. We compare an in-line approach with a solution using an explicit,
secondary resource and then see how collections can be used to cut the costs both
ways (total per resource, and gross/net of tax for all resources) without writing
any additional formulae.
VoIP over air as a surrogate modelling context
Because of the confidentiality issues mentioned above, we need a surrogate modelling
context as the background for a self-contained written explanation.
For the purpose of this exercise, we have quickly created a simplistic network model
for the roll-out of a fictitious VoIP over air service. The only costs
considered are customer premises equipment (CPE), a generic air interface, and a
multi-service gateway at core switching sites.
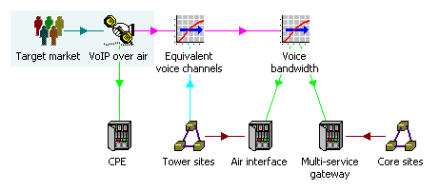
Basic network model elements
Very briefly, each subscriber is assumed to use the service for an average of 20
minutes a day, generating ~67mErlangs of traffic in the busy hour. A per-site
Erlang B calculation yields the capacity required to achieve a 1% risk of blocking,
and then an allowance of 32kbit/s is made for each concurrent voice call (including
air-interface packet overhead).
The network is rolled out across 100 sites in Y1 in time for launch in January Y2.
The model tracks the capital expenditure and maintenance costs of the network as
customer demand grows.
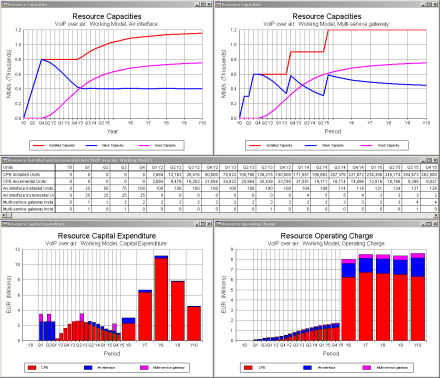
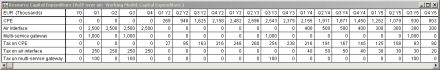
Inventory and net cost results
There is nothing remarkable about this initial analysis, which STEM will do for
you in minutes; this is just scene-setting and creative re-interpretation of the
original support question!
How can I model a 10% levy on selected capex and opex items?
The simplest solution is to take advantage of the User Data attached to each STEM
element, and craft a custom formula for the gross capital cost (or leased cost if
it is not a fixed asset). This is a core technique with myriad applications
wherever you need to extend the basic input space to accommodate all the dimensions
pertinent to a particular model.
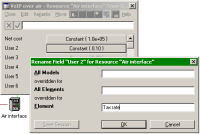
- Select User Data from the icon menu for a resource. The User Data dialog is
displayed.
- Select Rename Field… from the Edit menu. The Rename Field dialog is displayed.
- Type ‘Net cost’ and press <Enter>. The first row (User 1) is labelled
as ‘Net cost’.
-
 Move
the cursor down to User 2 and rename this as ‘Tax rate’.
Move
the cursor down to User 2 and rename this as ‘Tax rate’.
- Enter suitable values for Net cost and Tax rate. (These may be time-series.)
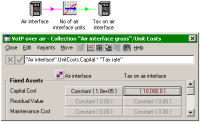
- Define the Capital Cost input with the formula, ‘Net cost’ * (1 + ‘Tax rate’).
You can click with the mouse to pick up the ‘Net cost’ and ‘Tax rate’ references
so that you don’t have to type them.
Now the tax is built in to the core Capital Cost input which STEM works with, and
the results will be automatically uplifted for each affected resource. If
the tax rate is the same for all resources, it would be more sensibly placed
in global User Data. And if you prefer to type the formula yourself, then you may
also prefer to avoid spaces in the variable names so as not to need the single quotes.
This is very easy to set up, and concise because the calculation is kept ‘within
the icon’. However, the results are only granular down to the individual element.
So if you want to report on the tax separately, or show the net/gross split for
an individual resource, another solution will be required.
Companion resources are the most flexible way to add new cost headings
STEM already has a range of built-in cost attributes, such as capital and maintenance
costs for fixed assets, and rental and usage costs for leased facilities, with a
very specific interpretation for reporting purposes and calculation from standard
inputs. If you want to introduce altogether separate cost heading in the results,
then it is usually better (clearer, and more flexible) to use separate resources
for each separate heading, and to use collections to aggregate them as required.
We will work through how this can be done for the Air interface resource
in the example above.
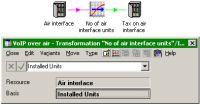
- Create a new transformation from the toolbar, named as ‘No of air interface units’.
-
 Control-drag
the resource onto the transformation to establish the resource as an input.
Control-drag
the resource onto the transformation to establish the resource as an input.
- Double-click the input link (pink) to review the input settings and change the basis
to Installed Units.
- Create a new resource from the toolbar, named as ‘Tax on air interface’.
- Control-drag the transformation onto the tax resource to create a requirement link
(green).
With a default capacity of 1.0, the tax resource will be installed in identical
quantities to the original air interface. We need to set two more inputs to
calculate the tax correctly.
-
 Set
the physical lifetime to match the original resource, as well as any pre-run profile,
so that replacement demand will be synchronised too.
Set
the physical lifetime to match the original resource, as well as any pre-run profile,
so that replacement demand will be synchronised too.
- Define the capital cost with a formula which references the original capital cost,
and the tax rate in User Data.
This technique can be repeated (with copy and paste) for whichever assets are affected,
and just as easily for opex costs as for the capex example shown. When you access
the results, you will see results for Tax on air interface alongside the
original Air interface results.
Net costs and tax for each network element
But what if you want to see the gross cost, or to see the impact of tax across all
affected resources?
Using collections to aggregate and group costs in different ways
The collection concept in STEM can be used to group any arbitrary set of model elements,
and to provide automatic calculation of aggregate results when all the grouped elements
are of the same type. So we can use one collection to calculate the gross Air interface
cost, and another to add up tax across all resources.
-
 Select
both the Air interface and Tax on air interface resources, and
then click the
Select
both the Air interface and Tax on air interface resources, and
then click the  button on the toolbar. A new collection is created, grouping the two resources.
- Name this as ‘Air interface gross’.
- Repeat for the other network elements, CPE and Multi-service gateway.
- Now select all of the tax resources and create another collection, named ‘Tax’.
- Create similar collections for the total net cost and total gross cost, as shown.
- Use the Colour Block command from the icon menu for the total collections to change
the colour of the columns, as this makes the two-way aggregation clearer.
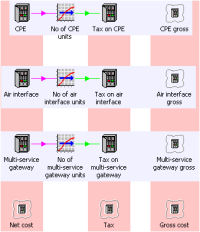
This structure is a side-calculation from the main business plan, and is best displayed
in a separate view to avoid cluttering the central logic. Each view provides
a different perspective of the model: the icons for the original network elements
appear in both views, but link to the same core data.
The collections in each row request the logic to add the net cost and tax to give
the gross cost for each individual network element, while the collections in each
column sum these respective costs over all network elements to report on total net
costs, total tax and total gross costs.
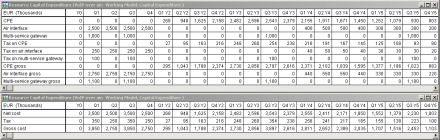
Tax and gross costs summed over all network elements
Transparent and self-documenting cost accounting
Although this might look like a lot of effort for little gain, the same structure
can be readily extended across much larger models with copy and paste. A huge benefit
is that the row and column sums are generated automatically, so there are few calculations
to check. The resulting solution is easy to understand and gives both modeller and
reviewer increased confidence in the consistency and integrity of the results.
 A
similar technique may be used to impose arbitrary aggregation hierarchies on an
existing model, perhaps grouping elements by network function in one direction (access,
transmission, switching, and so on) and supplier in another (vendor 1, vendor 2,
…).
A
similar technique may be used to impose arbitrary aggregation hierarchies on an
existing model, perhaps grouping elements by network function in one direction (access,
transmission, switching, and so on) and supplier in another (vendor 1, vendor 2,
…).
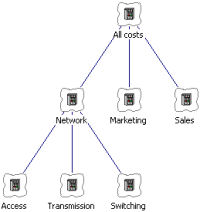
Collections can also be nested, so you might group all of these network functions
alongside separate collections for sales and marketing, which would in turn aggregate
their relevant costs. The icon hierarchy directly explains the aggregation structure
of the results, so the accounting model becomes self-documenting.