The qualitative benefits of using tools to streamline the creation of network models
are well documented. More specifically, STEM accelerates the process of business
modelling, and brings clarity, consistency, reliability and re-useability.
We have created a STEM model of the business-case modelling process itself. The
benefits of using STEM are quantified through the comparison of two scenarios, with
and without STEM, which demonstrate how STEM focuses effort on value-generating
activity. We show how the required effort may be reduced for a given modelling throughput;
alternatively, how much more value may be created at the same staffing level. The
model calculates a one-year payback in business insight generated after the initial
learning curve.
Applying the STEM modelling process to an investment in STEM
Why do operators create business cases for new services and technologies? The intrinsic
value of a business-case model may be expressed in terms of the potential benefits
to the business of adopting a better strategy on the strength of detailed analysis.
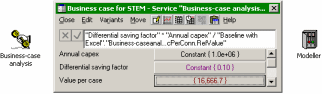
For our model, we will quantify this as a percentage of the operator’s annual capex
budget.
A Business-case analysis service element is used to
capture the internal modelling activity. For simplicity, we input the ‘annual traffic’
as the number of business cases required per annum for a single business-unit ‘connection’,
and define the ‘busy-hour’ as a year so that staff capacity is dimensioned on average
throughput, on the assumption that this activity is constrained by what the actual
team can manage, rather than hiring temporary staff to deal with peak demand. (We
may add a scenario to evaluate the benefit of bringing-in reputable consultants
later!) The ‘usage tariff’ for the service defines the value of a business case
recognised by the model.
Staff costs are captured with a Modeller resource element.
We ignore recruitment and retention costs, as these are not influenced by the use
of STEM, and consider just salary and overheads such as office costs.
In the simplest analysis, we could define a capacity directly in terms of business
cases per annum, e.g. three per individual, with a team of two generating six cases
per annum. Greater productivity with STEM would increase this capacity. However,
it is clearer to break the business-case activity down into separate tasks, such
as development, testing/correction, and socialising of results, in order to capture
more explicitly the distinct benefits STEM will add. We will translate each task
into an effort requirement, and measure the Modeller capacity in days of effort
per year, making an allowance for how much of the nominal working week is actually
productive.
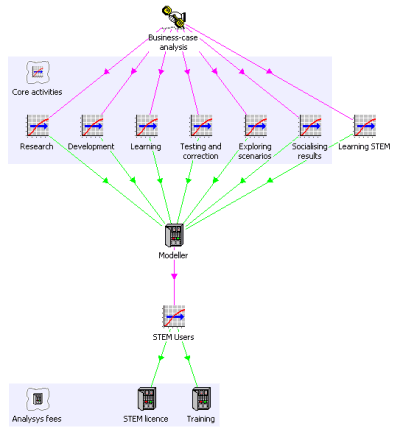
STEM model elements
Elements of business case production
Continuing the example above of each team member creating three cases a year, suppose
that a working year contains 48 weeks or 240 days, and that 80% (4 days) of their
working week is productive (away from email, meetings and so on). That means 192
productive days, or 64 days per business case across 16 weeks. Based on experience,
we make the following estimates of the effort required for the various tasks when
using Excel to create a typical business case, and the corresponding effort with
STEM:
|
Task
|
Issues
|
Excel
|
Interpretation for model
|
STEM
|
|
Research
|
Locating primary inputs: market, technical and cost data; independent of tool used
|
16 days (25%)
|
Fixed requirement per case reduces impact of STEM benefits
|
16 days
|
|
Development
|
Laborious re-working of basic calculations. Editing at the cell-level introduces
subtle copy errors which require a time-consuming review process
|
16 days (25%)
|
Improved productivity with STEM means less effort, and even less once there
are other STEM models to re-use
|
8 days, then 6 after 1 year
|
|
Learning
|
It is easy to overlook the time one can spend getting to grips with Excel functions
and how to create the logic which is built-in to STEM
|
2 days (~3%)
|
One-off time-out to learn STEM: five days’ training plus fifteen days practice,
but then only a slight increase in learning overhead
|
3 days, plus initial learning curve
|
|
Testing and correction
|
Much more of an issue with cell-wise logic, and with no built-in support to manage
the overall calculations. Two or three times as much effort without STEM |
16 days (25%)
|
Significantly fewer errors means much less effort with STEM
|
4 days
|
|
Exploring scenarios
|
STEM not only facilitates the creation of scenarios, it gets you to a working model
much quicker, leaving more time free |
7 days (~11%)
|
Spend the same time, to allow time to digest results, but gain new insights = 50%
more value |
7 days |
|
Socialising results
|
Arbitrary modelling techniques and a lack of high-level structure guarantee slow
handover as colleagues must comprehend the business logic cell-by-cell |
7 days (~11%)
|
Less time required to hand over models to colleagues as the structure of a
STEM model is evident from the iconic presentation, and the calculations follow
an established process
|
5 days
|
|
TOTAL
|
|
64 days
|
|
43 days
|
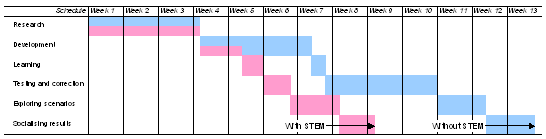
Effort estimates and corresponding schedule for an individual business case, with
and without STEM
Cost of implementing STEM
The model considers the capex and future maintenance cost of a perpetual STEM Licence for two users. The maintenance services of technical support
and software upgrades are included with the licence for the first year, and charged
at 15% of the initial licence fee per annum thereafter. In addition, there is the
explicit cost of the Training (Implied Logic fee), and the implicit cost (effort absorbed)
of this training and subsequent practice.
Quantifying the business value which STEM generates
The simplest analysis compares the required effort, staff and overall costs for
a given modelling throughput, with and without STEM. These first two scenarios are
called Baseline with Excel and Less
effort with STEM. A third scenario, More value with STEM,
increases the throughput to show how much more value may be created with the same
staffing level.
While reducing overall costs, the scenario Less effort with STEM also demonstrates
that STEM can increase business value because of the additional insights which can
be gained on the same business-case load.
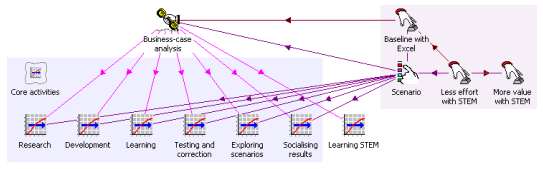
Linkage of scenarios with tasks and intrinsic value
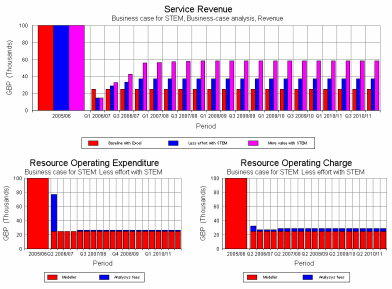
Modelling throughput, allowing for short-term interruption while learning STEM
The first two charts show the production of business cases per quarter, and as the
instantaneous annual throughput which is actually used to dimension the
Modeller resource. Note the temporary blip during Q1 when staff are training
and practising on STEM (twenty days each), and the potential additional throughput
in the More value with STEM scenario.
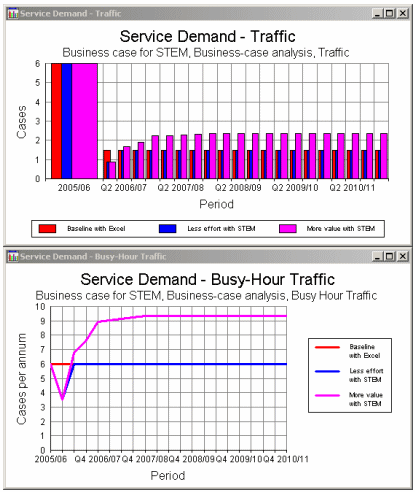
Business-case load per period, and instantaneous modelling throughput
The corresponding 36% reduction in staff utilisation on the original business-case
load is shown below, after the initial training period in Q1 (Less effort with STEM
scenario).
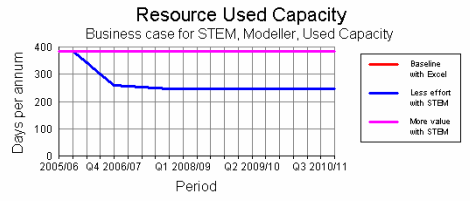
Reduction in staff loading
Comparison of effort
The following exhibits show the Baseline with Excel
split of effort between core activities, and then how this effort is reduced in
the Less effort with STEM scenario, and more focused
on value-generating activity in the More value with STEM
scenario. The potential savings offset the learning curve effect even in the first
year.
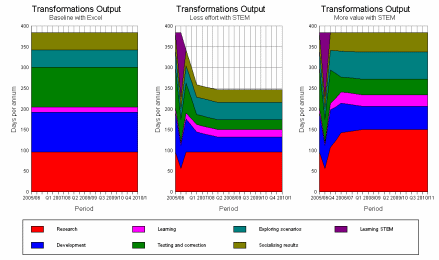
More time for research and exploring scenarios
STEM licence and training – Implied Logic fees
A perpetual STEM licence for two users is purchased in Q1 in both STEM scenarios.
The following charts respectively show the expenditure and depreciation for the
licence, as well as the initial training and maintenance (technical support and
software upgrades) from Y2.
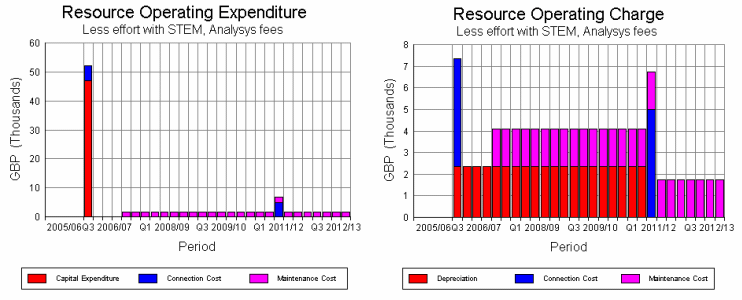
STEM licence, training and maintenance fees
Note: these charts show results for seven years to illustrate the initial licence
cost depreciated over five years, and also assume a refresher training course after
five years.
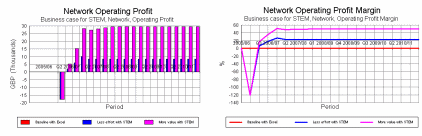
Business value compared with combined costs
Using our assumption about the intrinsic value of a business case, we can translate
the modelling throughput into business value, and then compare this with the combined
cost of the Modeller resource and
Implied Logic Fees.
The Baseline with Excel business value exactly matches
the cost of the Modeller resource, which suggests that
the model is reasonably well calibrated.
In contrast, the quarterly business value generated in the More
value with STEM scenario is almost double the combined costs. Even in
the Less effort with STEM scenario, the business value
is increased because of the insights gained on the original business-case load.
Business value compared with combined costs
Profitability and pay-back
The Baseline with Excel profitability is exactly zero
on the given assumptions. Naturally the cost savings and increased value imply better
profitability with STEM. This is easier to understand in margin terms – up to 50%
margin over current practice.
Profitability of working with STEM compared to baseline
Again the Baseline with Excel results are cashflow
neutral. Using a 10% discount rate, we see a payback on the investment in STEM after
18 months, or just one year allowing for the extra throughput in the
More value with STEM scenario. Given the timeless value of the investment,
this generates an internal rate of return in excess of 300%.
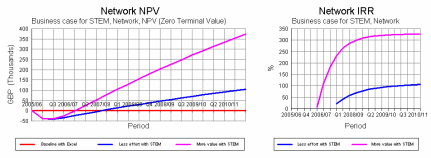
Net present value and internal rate of return
Buy STEM now to avoid costly mistakes later
The business model we have created serves two purposes. Firstly, it illustrates
the ease with which the business dynamics of a real-world situation can be captured
with the established STEM modelling process. Secondly, it puts the STEM investment
in perspective, compared to the underlying cost of the staff whose function it is
designed to enhance.
We have seen that the inevitable distraction of the initial training and learning
may be compensated for even within the first year by a significant (50%) increase in
productivity, as a direct consequence of spending less time on mundane spreadsheet
development and maintenance and thus more time on further value-generating activity.
(The Less effort with STEM scenario shows a 36% reduction
in staff loading on the original business-case load.)
The 50% profitability of the More value with STEM scenario
implies that the additional insights from every new business case alone justify
all of the Implied Logic fees over time. We have calculated a one year payback on the
initial investment, based on the assumed value of creating business models to determine
optimal strategies for large capital investments.