STEM 7.0 introduces a variant to the profile of a service which allows for a data
service to be described directly in terms of its nominal bandwidth requirement,
and then for the effective peak traffic and annual traffic volume to be derived
as calculated quantities. This new Peak Driven option contrasts with the
established Volume Driven methodology for voice services, which derives
busy-hour traffic from annual call minutes via an assumed daily traffic distribution.
Voice minutes and GPRS data
An abstract mathematical model is always easier to understand in the context of
a specific example, and we shall consider two typical services provided to 1000
mobile subscribers.

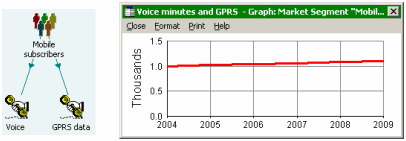
Voice and GPRS data services for mobile subscribers
For both the services shown, we assume the same subscriber base, growing from 1000
(to keep the numbers simple). The number of connections for each service is calculated
from a penetration assumption, which we can take as a constant 1.0 for the voice
service, on the basis that all mobile subscribers regard voice as the primary handset
application.
Firstly, we shall review the established traffic model for the voice service. We
start with an assumed Annual Traffic per Connection, typically measured in Call
Minutes. From the service provider’s perspective, this metric may be readily calculated
from average billing records; for an individual subscriber, this is easily imagined
as typical daily minutes multiplied by 365, or perhaps 250 for a business customer.
Again, to keep the numbers simple, we shall assume 20 × 250 = 5000 Call Minutes. (Usually we would segment the subscriber base to differentiate
between different calling behaviour and tariff plans.)
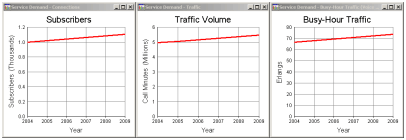
Thus the annual volume of minutes for the total subscriber base is 1000 × 5000 =
5 million Call Minutes. Revenue is driven by three tariffs: Connection Tariff (×
New Subscribers), Rental Tariff (× average Subscribers over a period) and Usage
Tariff (× Traffic Volume, calculated from average connections).
For dimensioning purposes, we need to estimate the busy-hour traffic, and this calculation
takes into account assumptions for the number of Busy Days per Year and Proportion
of Traffic in the Busy Hour, as well as the necessary Annual to Busy-Hour Unit Ratio
in order to convert from minutes to hours. We have already assumed 250 days in the
year, so with the default of 20% traffic in the busy hour, this gives us 5,000,000
/ 250 × 0.2 / 60 ≈ 67 Erlangs. (Typically this needs to be fed through an Erlang
B Transformation to calculate the number of circuits required to achieve a desired
grade-of-service, allowing for the number of Sites over which this traffic is distributed.)

Subscribers, annual traffic and busy-hour traffic for voice
In contrast, the calculation for the GPRS data service will be Peak Driven, and
we shall assume that there is a Penetration of 10% of all voice subscribers, i.e.
100 subscribers for GPRS. We start with an assumed Nominal Bandwidth per Connection,
say 56kbits/s, together with a Contention Ratio which defines the effective load
for dimensioning purposes. In practice this ratio may be derived from additional
parameters stored in User Data. For example, we might assume that at most 20% of
GPRS users will be active at any one time, even in the busy hour, and that each
user’s ‘duty cycle’ might only keep the connection busy for 10% of the time.
This implies a Contention Ratio of 50, and thus a peak traffic load for all subscribers
of 100 × 56kbits/s / 50 = 112kbits/s in the busy hour.
Assuming a similar distribution of traffic as for the voice service, i.e. Proportion
of Traffic in Busy Hour = 0.2 over 250 Busy Days per Year, and measuring annual
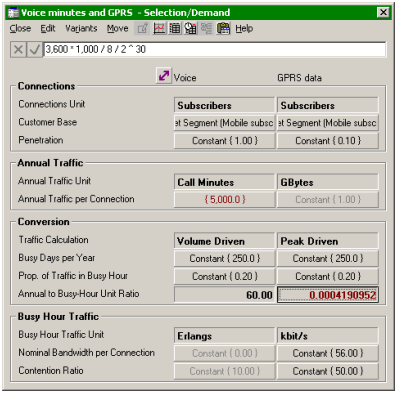
volume in MBytes, we would set Annual to Busy-Hour Unit Ratio = 3600 × 1000 / 8
/ 2 30 ≈ 0.00042 (seconds per hour; kbits to bytes; bytes to GBytes),
and then STEM will calculate the annual volume of data as 112 × 250 / 0.2 × 0.00042
≈ 58.8 GBytes.

Subscribers, annual volume and peak rate for GPRS
The actual inputs as entered for the two services in STEM are compared below.

Achieving greater realism
The example above is deliberately contrived to keep the arithmetic simple, and also
glosses over a couple of issues.
Multiple contention ratios
Firstly, the definition of a contention ratio depends very much on context. Within
a single UMTS cell, a lower contention ratio may be necessary to allow for the fact
that one or two subscribers may significantly tip the average if they happen to
connect simultaneously. In contrast, the greater numbers of subscribers aggregating
traffic in the core network means that the variance in demand will be lower there.
Thus a higher contention ratio may be used in the core network.
The Contention Ratio defined within the service element should relate to the edge
of the network; further efficiencies should be factored in, e.g. with a Multiplier
Transformation.
Quality of service (QoS) and ‘proper’ bandwidth aggregation
If a network carries multiple packet-switched services, then simply adding contended
bit-rates may overstate the required capacity by overlooking the extent to which
a low-priority service may exploit dimensioning headroom provided for a higher-priority
service.
VoIP traffic can be considered as having a very short window of opportunity (<
50ms) for useful delivery, whereas HTTP traffic from Web browsing may cope with
up to (say) 500ms delay, and email SMTP traffic up to (say) 60s. Accordingly, with
appropriate measures of tolerance for delay, tolerance of loss of capacity and mean
traffic levels for these different services, it may be possible to quantify how
much HTTP traffic can be carried in the ‘headroom’ provided for peaks in VoIP traffic,
and similarly, some of the SMTP traffic may ‘piggy-back’ on the other two services.
This will result in a leaner dimensioning model than simply adding contended bit
rates.
We invite comments on these ideas, which we hope to develop in further extensions
to the input parameters for service demand in a future release of STEM.