This article on the cost-allocation mechanism in STEM is written as one
in a series of how-to articles intended to raise both awareness and understanding
of the tool, emphasising the immediacy of the results, the scale of the calculation
addressed (compared to a spreadsheet), and the surprising detail generated by the
system and its latest developments.
STEM is designed to model the economics of network dimensioning
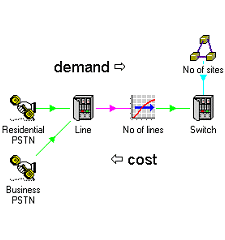
Real-life services offered to customers and the underlying network assets and functions
are modelled with the familiar STEM Service and Resource elements, providing a consistent
framework for the accounting of revenues and drill-down into capital and operating
cost streams. These financial elements are related through a series of causal relations,
in which the demand from a Service is mapped onto a Resource on the basis of either
connections, peak traffic or (occasionally) traffic volume (when considering interconnect
costs). Complex and secondary relationships are implemented via Transformation elements
which may generate multiple layers of cost.
 Where a single Service or Transformation
requires multiple Resources, STEM ensures the straightforward accumulation of these
costs in order to calculate the total cost of provision. The issue of cost allocation
must be addressed where multiple Services require a common Resource, e.g.
sharing the backbone network, or where a Transformation aggregates several separate
demands. Here we capitalise on the description of a STEM model in terms of its structure
rather than its formulae. The calculation framework for demand (which is generated
at run-time by inference from the relationships defined in the Editor) also forms
the basis for the cost-allocation mechanism.
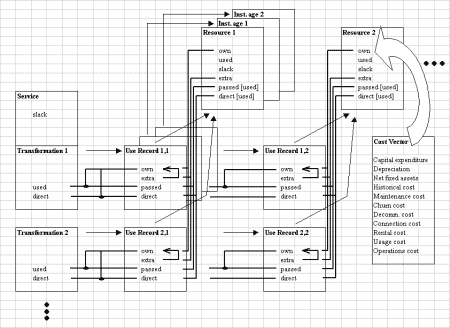
Where a Resource Requirement causes demand to be mapped from a Service (or Transformation)
to a Resource, a record is kept of the Service’s ‘total use’ of the capacity of
the Resource. It is this usage, as a proportion of the total capacity used by all
Services or Transformations, which defines the proportion of costs arising from
the Resource which should be allocated to the Service. Where an Expression Transformation
aggregates demand from multiple inputs, any Resource costs allocated to this Transformation
are sub-allocated between its inputs in equal proportions by default, with options
to:
- weight the allocation according to the respective scale of the demand inputs
- weight the allocation according to another basis, such as revenue
- assign specific proportions to each input.

Weighting backbone cost allocation by service revenue
Because this all happens ‘automatically’, the STEM framework delivers an immediate
awareness of service unit costs; and because the approach is systematic, the modeller
can have absolute confidence in the integrity of the results.
DIY is more than twice the effort
In order to understand how this all works, it is instructive to consider how you
would ‘do it yourself’. Conceptually, the process is (and must be, for auditing
purposes) quite straightforward, but while a single measure of demand may drive
the effective requirement for equipment, there are many facets to the complementary
cost allocation.
Firstly, each Resource may contribute multiple costs under various headings: depreciation
and maintenance for fixed assets, or connection, rental and usage costs for leased
assets. While allocated in the same proportions, these must be manipulated separately
in order to preserve the overall accounting separation at the Service level.
Secondly (and optionally in STEM), if you have taken the trouble to model the lifetime
costs of an asset to reflect its age, e.g. a unit maintenance cost which ‘switches
on’ at the end of a three-year manufacturer’s warranty, then it may be preferable
to pass this age distinction on to the service level, so that new equipment installed
specifically for a new service may present a ‘new equipment’ cost rather than a
cost averaged over the existing network. In order to achieve this goal, not only
must the costs of different installation ages be calculated separately, but of course
they must be allocated separately too. In STEM this is a natural extension of the
‘use record’ methodology outlined above; the spreadsheet equivalent is left as a
mental exercise for the reader.

Allocating multiple cost streams, ages and classifications
Thirdly, some key distinctions will be made between the allocated cost of equipment
capacity which is used directly by a service, and slack capacity which exists either
as planned redundancy or as a natural consequence of equipment unit capacities.
In order to compete on price, it is imperative for an operator to determine the
cost of the ‘efficient’ network, and thus, at the very least, to distinguish between
the allocated costs of used and slack capacity (see below for more detail).
So for each line of demand calculation in a comparable spreadsheet, a far bulkier
paraphernalia will be required to implement the required cost allocation for each
layer of a model. Not only must you work out how to do it, and invest the time to
do it, but then you must also take the time to verify that the outcome is as intended,
and that the results calculated add up.
The depth of analysis is being actively extended
One intention of this article has been to clarify the extent to which cost allocation
is a natural and intrinsic part of the STEM calculation cycle. In fact, STEM has
performed these calculations for Services for over a decade, and cost allocation
was a critical part of the specification process when Transformations were introduced
in the early 90s. However, the development process is always ongoing and we are
currently implementing a number of extensions specifically designed to enhance the
cost-allocation analysis.
Direct cost results
The existing used and slack cost results in STEM distinguish between the costs of
used and slack capacity of a Resource. For example, the Used Maintenance Cost result
for a Service is the share of maintenance costs from the used portions of all Resource
capacities allocated to that Service. This represents the cost of equipment which,
if removed, would directly compromise the network's ability to carry that Service,
as opposed to the cost of slack capacity, which reflects the combined cost of planned
redundancy and network inefficiency. The sum of these used and slack costs represents
the fully-allocated cost of providing the Service.
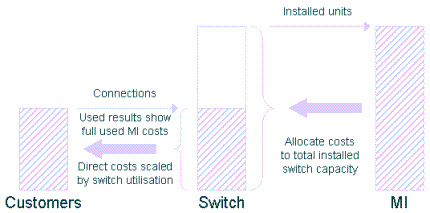
However, the concept of used capacity depends partly on perspective and the local
context within a model. Suppose that one connection for a Service requires one port
on a 100-port switch, and that each switch requires a single-switch management interface
(MI). With a demand of 50 connections, a single switch will be 50% utilised, but
the single MI will appear to be 100% utilised if it is dimensioned on the basis
of unit capacity with respect to installed units of the switch. It is certainly
true that, without the MI, the network will not function, whereas the network would
be fine with fewer ports on the switch.
So, the MI used cost will be the same right up to 100 customers, whereas it will
be more useful to understand the underlying cost per connection when considering
how the costs of the network will scale as demand grows. We are therefore now implementing
a new class of cost results, labelled ‘Direct Costs’, which are a refinement of
allocated used costs to allow for the utilisation of equipment generating a secondary
cost. In this example, the full used cost of the MI is allocated back to the switch,
but only 50% of this is then allocated back to the Service as a ‘direct’ cost. These
new direct-cost results are more closely variable with the underlying service demand
and will provide a better indicator for long-term tariffing decisions.

Used and direct costs compared
Intermediate slack results
As this article has explained, the allocation of used costs is implemented through
each Transformation in a chain of demand in a model. Rather than mirror this framework
for the costs of slack capacity, a Service’s responsibility for the slack capacity
of a Resource is calculated according to its direct and indirect historical usage
of that Resource, and then the slack costs are passed directly to the Service in
proportion to the comparable responsibility of other Services. Thus slack results
are only available for Services.
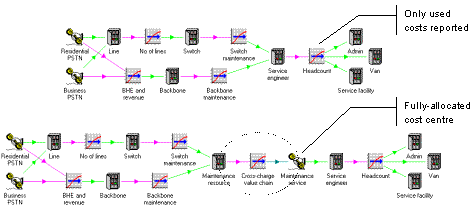
Where a network is modelled in several natural layers, e.g. service offerings mapping
down onto service capabilities, perhaps mapping further down onto network functions
and underlying transport, then it may be insightful to measure fully-allocated (i.e.
used plus slack) costs at an intermediate level. We are now trialling an extension
in which a Service could replace an intermediate Transformation in order to generate
intermediate slack costs, while retaining the Transformation behaviour of allocating
costs back to the primary services. This would reflect a kind of internal value-chain;
but whereas the existing value-chain feature in STEM is designed to model the re-sale
of an external commodity, mapping secondary revenues on to primary costs, this would
be naturally interpreted as an internal cross charge.

Intermediate Resource / Service pairing defines internal cross-charge boundary
Note: the algorithm for allocating slack capacity is described in the feature entitled
Cost Allocation in the Model Features volume of the STEM User Guide.
Breakdown of Service results by Resource
The primary goal of these cost-allocation mechanisms is to calculate the most pertinent
unit cost for external service offerings, but a secondary initiative will be then
to analyse the breakdown of these costs by Resource in order to identify the best
targets for cost-reduction measures. This has been a longstanding objective for
STEM, and one delayed partly by concerns over the potential size of the Service / Resource results set, and the challenge of a workable user interface to restrict
it.
However, some recent analysis suggests that in fact it may be possible to infer
a manageable and sparse subset of this space from the typically sparse set of Resource
Requirements defined within a model, and we now hope to produce a prototype system
in the next few months which would produce the following key results for a Service:
- breakdown of separately allocated costs by each Resource directly or indirectly
required by the Service
- breakdown of sub-total allocations by each Resource directly required by the Service.
In a model where intermediate Resource / Service pairs are used to define layers,
then such a pairing would limit the scope of the separately allocated breakdowns
to a single layer.

Determining the scope for Service cost breakdown by Resource