Telkom Indonesia wished to model a voice backbone network with 29 trunk switches
from three different manufacturers, and to analyse the long-run incremental cost
(LRIC) of each service. Here, each possible route between two trunk switches (including
each trunk switch by itself) is considered as a service – a total of 435 routes
(30×29/2). Building such a complex model would normally be a time-consuming process,
but the new replication feature in STEM version 6.2 enabled Telkom to quickly
determine the LRIC of a minute of traffic on each of these routes.
Our associates, Network Strategies Ltd, worked together with Telkom staff and
regional industry specialist, Jude de Silva, to develop this model in the context
of an extensive activity-based costing (ABC) project precipitated by the prospect
of competition in the market from January 2003. The model framework outlined below
provides an intricately detailed and thus credible analysis of the effective cost
of carrying voice calls on the backbone network. As Telkom and other incumbents
around the world face the liberalisation of their local markets, such data will
be central to operators’ dealings with regulators.
Modelling structure
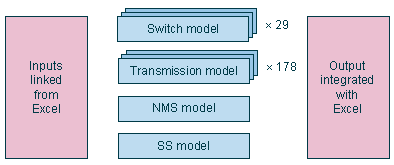
The 29 trunk switches are connected by 178 bearers (backbone links), each using
one or more transmission technologies (fibre, satellite or microwave). In addition,
there is a network management system and a signalling system.
The analysis requires six separate models: one model for each of the three types
of trunk switch, one model for the bearers, one for the network management system
and one for the signalling system. There are also a number of associated Excel workbooks,
for: demand inputs, general assumptions, resource costs and processing of output.

Switching
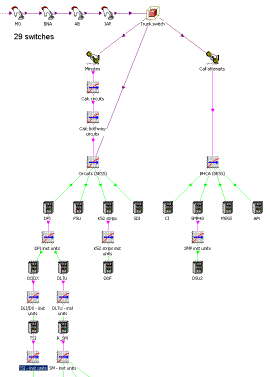
There are three types of switch – the NEAX, the EWSD and the 5ESS – and each has
its own STEM model. Each model contains a single template specifying the elements
that are to be replicated, plus instructions to replicate these elements 29 times
in total.

Dimensioning by busy-hour Erlangs and busy-hour call attempts
The inputs to each switch are the annual minutes and busy-hour Erlangs, and the
annual call attempts and busy-hour call attempts. This data is used to calculate
the costs of each switch, namely call conveyance costs (driven by busy-hour Erlangs)
and call switching costs (driven by busy-hour call attempts). The results used are
the annual conveyance operating charge per minute, and the switching cost per annual
call attempt.
Transmission
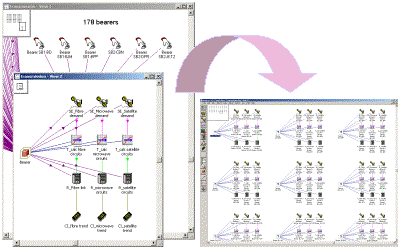
The network has three bearer technologies (fibre, microwave and satellite) and each
bearer can use more than one technology between its two end-points. Another template
is used to replicate this part of the model structure, in this case 178 times. Each
replication input specifies the number of minutes and call attempts for each technology
on a particular bearer. The cost of each bearer has been pre-calculated on a per-circuit
basis.

Transmission model and replicated detail
Signalling network
The signalling network consists of six STPs, two SCPs, and the switch-STP and STP-SCP
links; each trunk switch is connected to two STPs. These STPs, also modelled using
replication, are driven by the signalling links from the switches connected to them.
The costs of the STPs are thus allocated to the busy-hour call attempts carried
by each switch.
Network management system
The network management system consists of management links, routers, interfaces
and the management server. It is a fixed-cost system, and the model allocates the
costs equally through the devices which the system monitors: the trunk switches,
STPs, SCPs and backbone trunks. Nodes of the access network are also monitored,
but these are not included in the model.
LRIC calculation
A conventional LRIC model calculates the incremental cost of an operator providing
a service, compared with not providing that service. However, in this case the objective
was to allocate the fixed costs and common costs to the service (also known as LRIC+),
so that the cost of a minute of traffic on a particular network segment is the same
for all services carried across that segment.
Therefore, to calculate the LRIC we simply calculate the operating charge (depreciation
plus operating cost) per call minute: the total annual charge on each device divided
by the total annual traffic that the device carries. To calculate the cost of a
minute on any route, the costs of each component it uses are summed.
The significant results of the cost calculation are:
- cost per minute and per call by route
- cost per network element by switch and bearer
- average cost per zone.
Interface with Excel
The input workbooks specify the demand for each route. The network topology is defined
by a table specifying the switches (end-points and intermediate) and bearers used
by each route. This topology table is used to generate demand matrices defining
the traffic carried by each switch and each bearer. This traffic is then linked
into the replication inputs in the STEM models.
An output workbook processes the results of the STEM models. It takes the operating
charge for each switch and bearer, and then uses an inverse demand matrix to map
the cost of each switch and bearer onto the routes. This is then divided by the
traffic carried on each route to calculate the cost per minute for each route.
Summary
The methodology outlined in this article has enabled Telkom Indonesia to model its
existing voice backbone network to the level of individual switches and bearers,
and thus to calculate the LRIC of each route on that network. Such a detailed understanding
of the costs of service provision will be of vital importance in developing competitive
pricing when the local market is liberalised in January 2003, and will prepare the
ground for dealings with the regulator.