 The Faculty of Electronics
and Information Technology at the Chemnitz University of Technology in Germany has
recently been carrying out research into interconnection within IP-based next-generation
networks (NGNs). In legacy systems, interconnection is provided on a best-efforts
basis, but NGN technology makes it possible to provide interconnection services
that support several different levels, or classes, of quality of service (QoS).
This article describes a STEM model that we have used to examine the cost benefits
for an ISP of replacing best-effort with QoS-supporting interconnection.
The Faculty of Electronics
and Information Technology at the Chemnitz University of Technology in Germany has
recently been carrying out research into interconnection within IP-based next-generation
networks (NGNs). In legacy systems, interconnection is provided on a best-efforts
basis, but NGN technology makes it possible to provide interconnection services
that support several different levels, or classes, of quality of service (QoS).
This article describes a STEM model that we have used to examine the cost benefits
for an ISP of replacing best-effort with QoS-supporting interconnection.
Understanding the commercial context
As soon as QoS-supporting interconnection is introduced into the telecoms market,
the conditions regarding interconnect settlement charges within the service level
agreements (SLAs) between customers and service providers are expected to change.
Introducing several QoS classes can be handled internally to the network as well
as externally. The latter appears to be more obvious and will lead to the offering
of several classes of interconnection service.
Our experience, based on a study of the literature and our own simulation work,
revealed that the introduction of differentiated, class-based QoS using just a simple
set of, for example, four classes is likely to be widely acceptable as well as efficient.
By this we mean that the user’s quality of experience for time-critical services
in such a QoS-enhanced system can be sustained in the context of higher link utilisation
rates, which thus allows for delayed upgrades in the speed of interfaces, even with
higher link utilisation rates. This also holds true for transit and peering connections,
as long as both peers can agree on a common set of classes (for transit), or class
set mapping (for peering).
In order to understand the costs of class of service (CoS) enhanced IP-based NGNs,
we have built a STEM model of an imaginary German ISP’s network. The model includes
all the usual key components, such as market share, service take-up by the assumed
user base, required network components, selection of connection speed and resultant
interconnect traffic.
The network covers three regions and seven major cities within Germany, as depicted
in Figure 1. The network structure within each of the cities is assumed to have
a star-like access line structure, and metro backhaul in a ring structure.
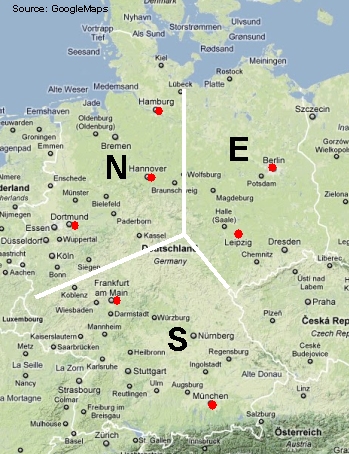
Figure 1: Modelled network with three regions and seven major cities
The following main assumptions have been made in developing the model:
- Throughout the network there is a consistent separation of traffic into at most
four classes: expedited forwarding (EF), assured forwarding (AF), best effort (BE)
and lower effort (LE).
- The market share of the ISP in the different cities is assumed to increase in line
with an S-curve model. A penetration of 100% of households and businesses within
those cities is assumed for simplicity reasons.
- Users are offered a choice of five ‘access service profiles’ with different proportions
of the various classes of service. That is, each user considers their requirements
in terms of the main type of traffic they will generate, and then orders the service
with the access profile that best matches their requirements and their budget.
- The maximum market shares are based on actual inhabitant numbers.
- Simulations have been based on a run period of 10 years.
- The network technologies used in each city have been modelled with a function that
automatically implements an appropriate migration decision. Technologies considered
include routeing and switching equipment (1Gbit/s, 10Gbit/s, 40Gbit/s up to 100Gbit/s)
as well as copper or fibre-based access technology.
- Capex and opex costs as well as the physical and financial lifetime of the resources
are included in the model.
- We have modelled the interconnection structure of the imagined network, including
differentiation between in/out traffic and transit/peering traffic, in order to
analyse the fixed and variable cost structure of the newly deployed CoS interconnection.
The resulting model allows for simulation and reporting of:
- assumed evolution of market share
- resulting usage (traffic demand) for each of the four service classes
- automatic installation and migration of network resources for routeing, switching
and access
- detailed expenditure (capital expenditure + operating costs) for the network resources
- transit/peering costs and volume-dependent traffic costs for the interconnection.
Modelling the cost dynamics of the CoS NGN in STEM
The STEM model of the envisioned German NGN has been developed as depicted in Figure
2. A template structure is used to replicate the network structure within the seven
cities. For each city, the template specifies the expected market size, user take-up
of the five different CoS profiles (see Figure 2 and Table 1), the resulting
traffic demand for each of the four classes of service, the automated selection
of technology (see Figure 3), and finally the demand-dependent access technology
(see Figure 4) deployed.
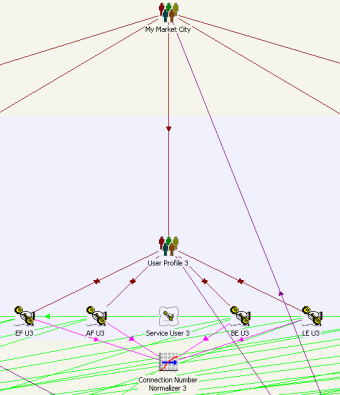
Figure 2: Example user profile within the city template structure
|
|
Profile 1
|
Profile 2
|
Profile 3
|
Profile 4
|
Profile 5
|
|
EF
|
10%
|
20%
|
5%
|
10%
|
0%
|
|
AF
|
30%
|
30%
|
35%
|
20%
|
0%
|
|
BE
|
50%
|
50%
|
50%
|
50%
|
100%
|
|
LE
|
10%
|
0%
|
10%
|
20%
|
0%
|
Table 1: Access service profiles offered, showing relative proportion
of classes of service within each profile
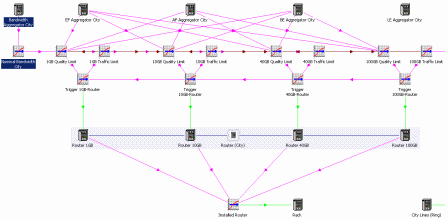
Figure 3: Automatic selection of technology: routing/switching equipment
The decision to change from one transport platform speed to the next (higher or
lower) is taken based on the traffic demand. Two decision thresholds are implemented,
which define (a) the maximum overall traffic load for each technology before an
upgrade is required, and (b) a specific threshold for each traffic class which can
trigger an early upgrade decision if the share of high-value traffic has crossed
a specified share of the total capacity load. The actual technology deployed is
decided based on whichever of these two thresholds is passed first.
A similar decision function is implemented for the migration from copper to fibre-based
access technology. In this case the sheer traffic volume being carried on the access
lines steers the decision process.
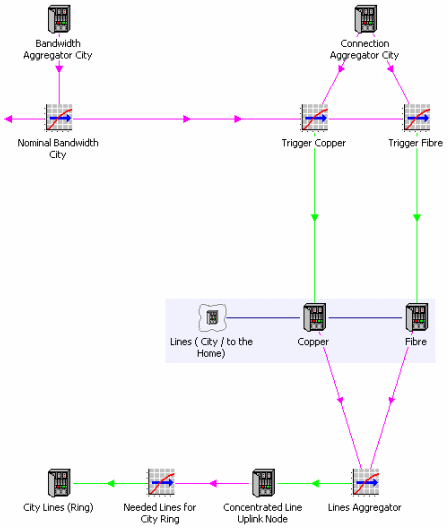
Figure 4: Automatic selection of technology: copper or fibre-based access
The total load carried by the ISP’s network depends on the traffic from each city,
each region and the whole country. Some of this traffic is passed on to external
networks run by other operators with which the ISP interconnects. The interconnection
traffic flowing out of the network is then split into peering traffic (which is
carried free) and transit traffic (for which a charge is made). The resulting transit
costs are calculated based on an assumed differential of transit traffic out to
traffic in (based on benchmark figures). The annual connection fees for the actual
transit or peering network connection are modelled according to the required interface
speed of that connection link. The speed of links is changed each year turns as
the increase in traffic requires an upgrade. Figure 5 depicts this part of the NGN
interconnection using the EF share of the transit and peering interconnection. Traffic
demand aggregated over all class shares leads to the actual interconnection speed
selection, as shown in Figure 6.
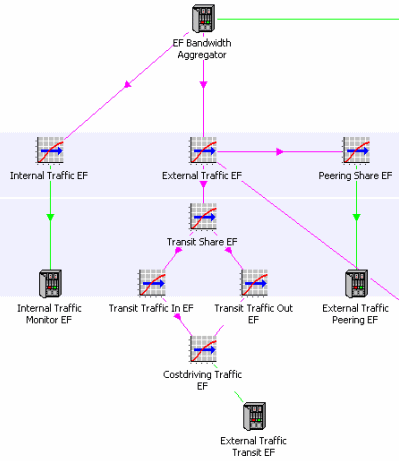
Figure 5: Traffic share at the interconnection points – EF traffic example
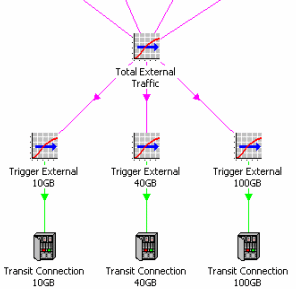
Figure 6: Connection speed transition based on total interconnection traffic demand
Analysing the technical and financial results
The first results of the STEM model described above are providing initial insights
into the cost drivers of each part of the model, and building up a rather detailed
understanding of which factors need to be focused on for market and network analysis.
Although in its present form the model’s parameters are not based on real operator
traffic measurements and actual network elements, we believe that the model is readily
easily adjustable, and incorporates the fundamental drivers of costs and technology
transition decisions. The following figures show some characteristic graphs of network
operation and transition decision points, which in turn are reflected in the capex
and opex cost structure of the business. These numbers are illustrative only, due
to the academic approach of the current model.
The starting point of the sequence of result figures is Figure 7, which documents
the assumed market share development over time for the seven cities.
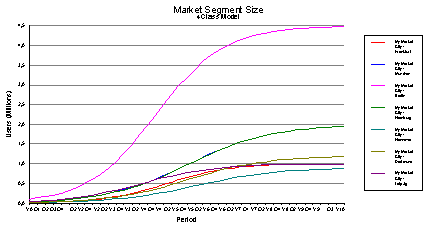
Figure 7: Assumed market size development for the seven cities
As an example, Figure 8 shows the peak busy-hour load for traffic of class EF that
is generated by users in Frankfurt subscribing to each of the five access profiles.
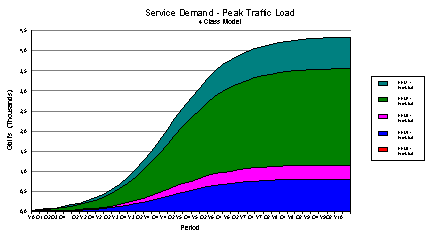
Figure 8: EF traffic generated by users in Frankfurt subscribing to access service
profiles 1–5
The following figure is just one example graph showing the actual routeing and switching
equipment deployed in Frankfurt depending on the underlying development of traffic
demand for the city. The graph shows how, for example, the amount of 1Gbit/s equipment
installed increases up to 18 units, before the decision is made to gradually install
10Gbit/s interfaces. It also reveals the actual lifetime of the already installed
units and their decline after that. The red 100Gbit/s line remains at zero, since
Frankfurt’s traffic does not require an upgrade to that speed within the simulated
10-year period.
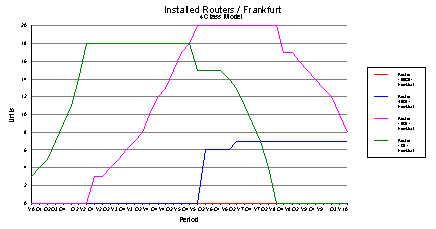
Figure 9: Transport platform technology migration example for Frankfurt
Figure 10, however, shows the same graph for the larger city of Berlin, which actually
does cross the 100Gbit/s deployment threshold.
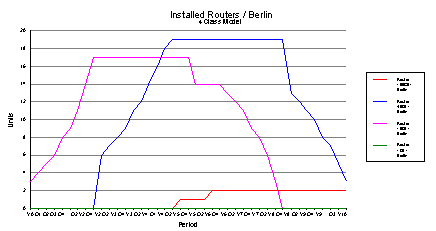
Figure 10: Transport platform technology migration example for Berlin
Similar transition curves reveal the expected timing of fibre installation activities:
Figure 11 shows the migration for the two example cities mentioned.
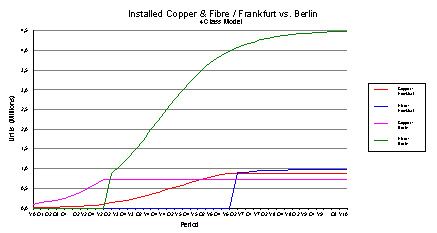
Figure 11: Access line technology migration for Frankfurt and Berlin
Changing the view on the cost side, Figure 12 depicts the annual connection fees
for the network’s interconnection. The figure also shows the speed upgrade of the
interconnection interface due to rising traffic levels.
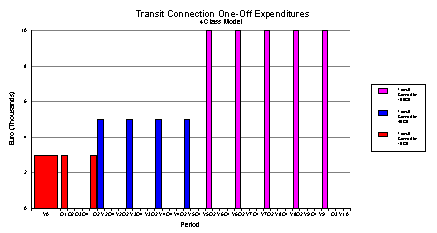
Figure 12: Annual connection fees for different interconnection speeds
On top of these fixed interconnection fees are volume-based transit costs, which
vary for the different classes of traffic carried by the external network.
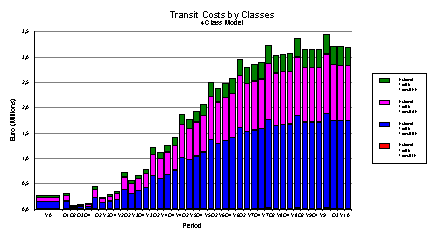
Figure 13: Transit traffic costs for the four different traffic classes
The costs of transit depend on the maximum allowable link utilisation, which in
turn depends on the quality of experience being offered to users. Figure 14 shows
the case when only a single CoS (best effort) is provided. As can be seen, the transit
costs are actually lower than for a traditional ISP network, since the less expensive
best effort transit service is used. However, high-quality transit traffic interconnection
will not be possible in high-load situations with the single-class setup.
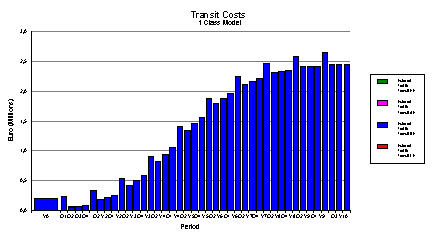
Figure 14: Single class interconnection transit traffic costs using different allowable
link load settings
The rather dense charts below compare the total cost of ownership (TCO) of the whole
network in the four-class case (Figure 15) and the single-class, best effort case
(Figure 16). Following the operating expenditure curve, the operator’s strategic
planning team operator can understand the financial build-up and investment cycles,
as well as the required staff and marketing expenditure, from a cost-related point
of view.
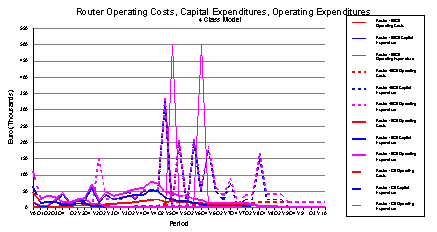
Figure 15: Operating Costs + Capital Expenditures = Operating Expenditures
in the four-class case
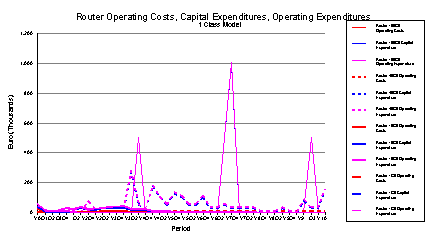
Figure 16: Operating Costs + Capital Expenditures = Operating Expenditures
in the single-class case
Whether or not operating a CoS-based network is an advantage for the operator depends
heavily on the parameters assumed and the amount of cost reduction that can be achieved
through the use of a higher-capacity transport platform. As can be seen from the
results presented above, the decision for or against a CoS-based network is not
a simple yes or no, but rather should be derived from a model such as the one described
here, suitably enhanced with actual traffic figures and the chosen thresholds for
transition to higher-capacity equipment.
Readers wishing for more information may contact the authors:
Thomas Knoll (Chair of Communication
Networks) and Paul Walther
at the Faculty of Electronics and Information Technology at the Chemnitz University of Technology.