STEM support staff have been helping Swisscom Mobile to create a concise
model for the roll-out of their future UMTS network. Vendor selection is already
complete, and the network will be implemented with components from Ericsson, including
‘Node B’ configuration macro sites from the RBS 3200 Series. For financial planning
purposes, there is no requirement to model each base station individually, and a
simpler model has been developed reflecting initial deployment and incremental
roll-out strategies.
Without going into the fine detail of specific services offered by Swisscom Mobile,
there are some standard rules for calculating the bandwidth requirements of various
classes of voice and data service as shown in the following table.
|
Service
|
Channel elements
|
Max. simultaneous users
|
|
Speech (12kbit/s)
|
1 |
32 |
|
16kbit/s
|
1 |
32
|
|
64kbit/s
|
2
|
16
|
|
128kbit/s
|
4
|
8
|
|
384kbit/s
|
8
|
4
|
Forecast demand for each of the various services is thus aggregated according to
these factors to allow the Node B’s to be dimensioned in terms of channel elements
alone. Note: the roll-out and demand data in this article are example data only
and bear no relation to any forecast or actual data from Swisscom Mobile.
Initial geographic deployment and phased upgrades
During commissioning and early adoption of the network, the initial priority is
to achieve geographical coverage according to marketing objectives and licence obligations.
This roll-out objective is captured as the Sites input of a Location element, ‘Network
roll-out’, which governs the deployment of the basic node installation which has
a capacity of 64 channel elements. A Transformation, ‘No step 0’, links the number
of installed units to a second Resource representing the ancillary one-off and recurring
costs of establishing the base station.

Initial geographic deployment
Of the three possible configurations for a Node B (3-sector, 2-sector or omni),
the model only considers the 3-sector mode, for which the following capacity upgrades
are possible.
|
Step
|
Description
|
Max. simultaneous
voice users
|
Total capacity
(Mbit/s) |
Basic node
(step 0)
|
64 channel elements
|
64 |
0.76
|
|
Step 1
|
Additional 32 channel elements
|
96 |
1.14 |
|
Steps 2/3
|
Extra carrier and additional 32 channel elements
|
128 |
1.53 |
|
Step 4
|
Additional 32 channel elements
|
160 |
1.91 |
|
Step 5
|
Additional 32 channel elements
|
192 |
2.29 |
For the geographical roll-out of the network, we wish to model a phased upgrade
of the initial 64-channel-element base-stations, such that first the Step 1 upgrade
is effected only as demand exceeds the basic capacity of nodes, and then Step 2/3,
and so on. This conditional installation rule applies to many equipment upgrade
scenarios, and a general technique is to pre-calculate certain ‘breakpoints’ for
splitting demand between different Resources. That sounds complicated, but is readily
modelled in STEM.
The roll-out plan is captured as a straightforward Interpolated Series, in this
case covering 100 sites over two years. Then the key upgrade parameters (as shown
in the table above) are used to calculate the basic capacity and maximum upgrade
capacity of the initial base stations.
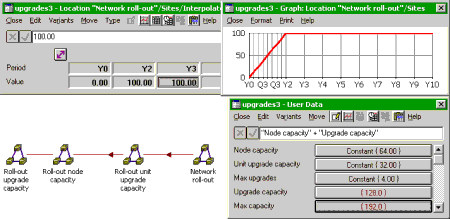
Network roll-out constraints
These capacity values act as the breakpoints for the split of demand between the
initial base stations, upgrades to those base stations, and any residual demand
for incremental roll-out.
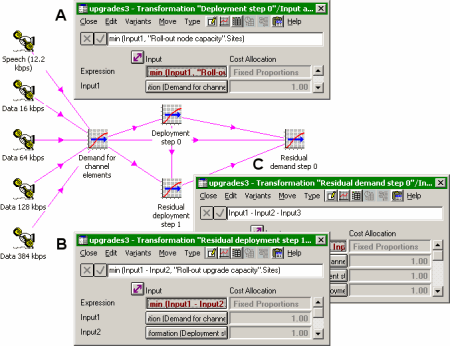
Breakpoints for node and upgrade demand
Thus the two separate inputs of planned roll-out, ‘Network roll-out’, and forecast
demand, ‘Demand for channel elements’, are combined to show the desired phased demand
(in terms of channel elements required) for nodes and upgrades.
Phased demand calculation
Similarly, a chain of Transformations is used to segment the demand for upgrades
to initial nodes between the successive upgrade steps. Two Transformations are required
per step:
- the first calculates the remaining demand left after the previous upgrade step
- of this remaining demand, the second claims up to the maximum achievable by the
current upgrade step, within the bounds of the currently deployed network.
(This could be effected with a single Transformation per step, but only at the price
of scaleability. Each Transformation would have to subtract off the total demand
claimed by all of its precedents, with progressively more terms at each step.)
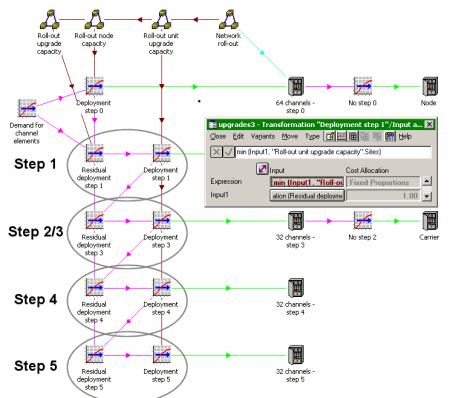
Deployment upgrade demand chain
Notice how a Transformation, ‘No step 2’, links the number of installed units of
‘32 channels – Step 3’ to a second Resource representing the costs of the carrier
prerequisite for Step 3.
Incremental roll-out of new nodes leads progressive site upgrades
The phased upgrade strategy can only be maintained for a finite period before forecast
demand exceeds the maximum upgrade capacity of the deployed network. Moreover, high
density of traffic in certain areas necessitates the introduction of fill-in base
stations, and the longer-term profile of network roll-out will show a bias towards
more recently installed base stations which are upgraded later than the existing
network.
If the network were only extended with fully-upgraded base-stations, then the parameters
in the first figure above (Network roll-out constraints) would suggest
a proportion equal to node capacity / max capacity (i.e. 64/192 or 1/3) of the demand
would be carried by 64-channel nodes, and then 1/6 by each of the upgrade steps
1, 2/3, 4 and 5. A second chain of two Transformations per step uses a simple skewing
multiplier to increase these proportions in favour of the earlier steps:
- the first calculates the remaining demand left after the previous upgrade step
- the second claims its nominal share of this demand, inflated by the skewing factor.
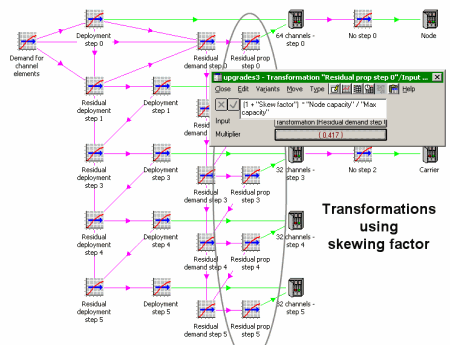
Incremental roll-out demand chain
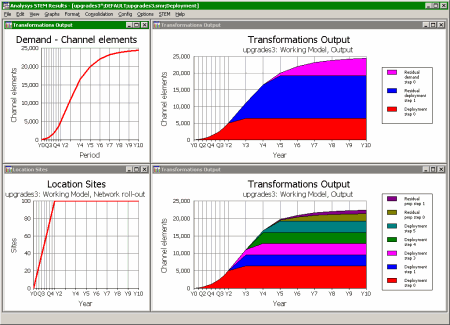
As you can see from the following results, this then yields the desired results
for the separate initial deployment and incremental roll-out stages of network evolution.
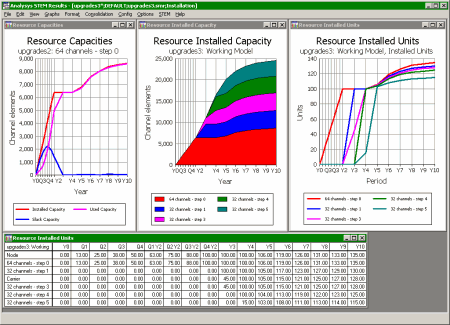
Phased installation results
These results arise from inputs deliberately chosen to exaggerate the separate dynamics.
A more sympathetic roll-out plan will yield a more continuous and realistic evolution.
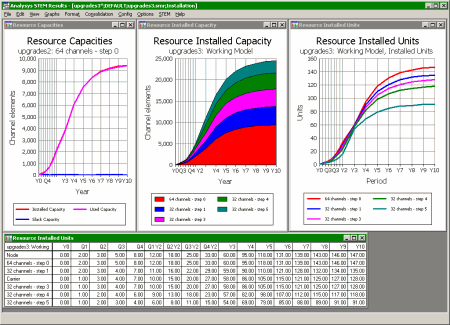
Better calibrated phased installation results
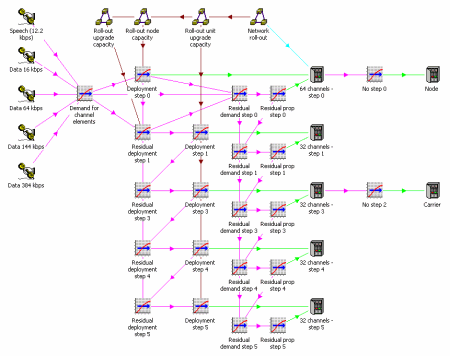
Full upgrade model structure
Note: the elements shown are only an indicative sub-set of the actual model.
Swisscom Mobile has
the largest market share in the Swiss mobile communications market, and its NATEL®
network (GSM900 and GSM1800) supports new technologies such as HSCSD, GPRS and most
recently Public Wireless LAN.