Every STEM user will be familiar with the right-click problem, specifically the seemingly contrary behaviour of so-called time-series buttons in data dialogs. For historical reasons, such a button must be right-clicked to select and only left-clicked if you want to access the time-series parameters within, whereas a more contemporary sensibility would expect left-click to be the milder option.
Finally this issue is settled in STEM 7.4 with the demise of the ubiquitous time-series button in its present form. In its place we have a small and very pragmatic ‘wandering’ button which only appears alongside the current field, and an intuitive right-click context menu with a host of relevant functionality in addition to accessing the parameters.
A STEM 7.4 Beta 1 release is now available to experienced current licensees who are ready to shoulder some risk while evaluating the new features. Please contact us directly if you would like to participate in the beta programme. Our aim is for the final version to be on general release by the end of July, subject to sufficient and successful testing.
|
Editor
|
|
Calculations
|
| ‘Right-click’ solution |
|
Straight Line time-series type |
| Find elements/views/text in formulae, values and notes |
|
Previous transformation types |
|
Integrated user-guide and help as online and offline HTML |
|
Delta and Cumulative Sum transformation types |
| Option to hide scenarios |
|
New Deploy With Utilisation and Minimum Slack inputs |
| Tooltips for long dialog captions |
|
Cumulative capex (and other results) in standard default.cnf |
|
Discount Rate in the Editor |
|
Established approach for calculating economic depreciation for regulatory accounts (LRIC) |
|
Results program
|
|
External interfaces
|
| Per graph consolidation |
|
Export results to native .xlsm format for Excel |
| Smart tick-marks for sub-annual periods |
|
Exporting input data to link back from a database |
| User-definable colour palettes |
|
Export results to ODBC |
| Option to suppress Y0 (column and/or line charts) |
|
Tornado charts on the web, and in Excel |
| Optional smoothed lines |
|
|
Figure 1: Overview of the most significant new features in STEM 7.4
1. Editor
‘Right-click’ solution
Really you have to try out the new Editor to see how the new, ‘wandering’ button works. In fact it takes quite a while to unlearn the right-click instinct, but it is worth the effort.
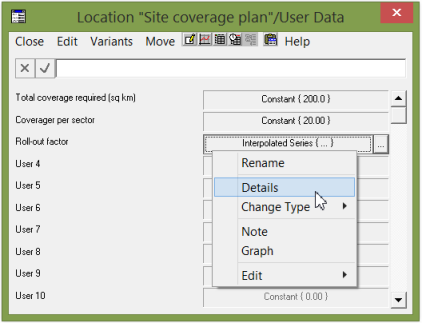
Figure 2: Single ‘wandering’ button and right-click context menu
We have made a number of related tweaks to the data-dialog environment, the majority of which will be self-explanatory and intuitive. For example, you can now press <Del>
to unset a selection of fields, and <Ctrl+A> to select all fields in the dialog (or all text while editing a formula).
Find elements/views/text in formulae, values and notes
It has long been a challenge to locate a specific element in a large model with multiple views. The original Select Elements dialog made it easy to add existing elements to a new view for auditing purposes, but not to locate an existing icon in its intended context. So now we have added a comprehensive Find function (accelerated as <Ctrl+F>) which will bring up a list of elements (cross-referenced by view) matching some given search text.
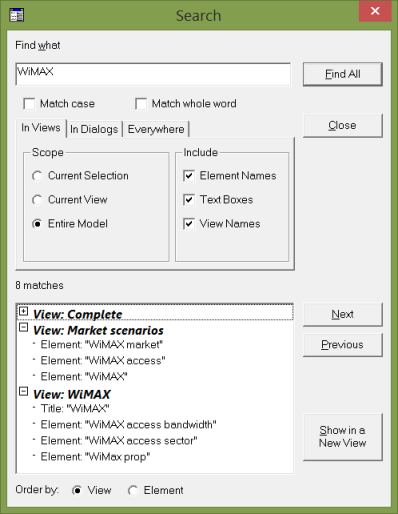
Figure 3: Find dialog showing elements matching ‘WiMAX’ in three separate views
The scope of the Find function when initiated from the main Editor window also includes view titles and text boxes within the view. When initiated from a data dialog, the default scope alters to formulae, values and notes within dialogs of the current model, and in both contexts you can optionally extend the scope to cover all possibilities.
The natural find-and-replace equivalent is ‘in the works’ and will be added in a future release.
Integrated user-guide and help as online/offline HTML
STEM 7.4 incorporates a completely new documentation / help system. The new, linear user guide is presented in template HTML, and pressing <F1> within the software for online help now jumps straight to the relevant page of the same HTML.
Help on specific inputs and results is presented in two ways:
- alphabetically in the user guide
- by data dialog from the software.
These listings are generated from the same content for maximum consistency.
Help content may be accessed online (if connected), or otherwise from a static offline help image installed with the software. The online version will benefit from the latest additions and corrections, and will facilitate immediate feedback!
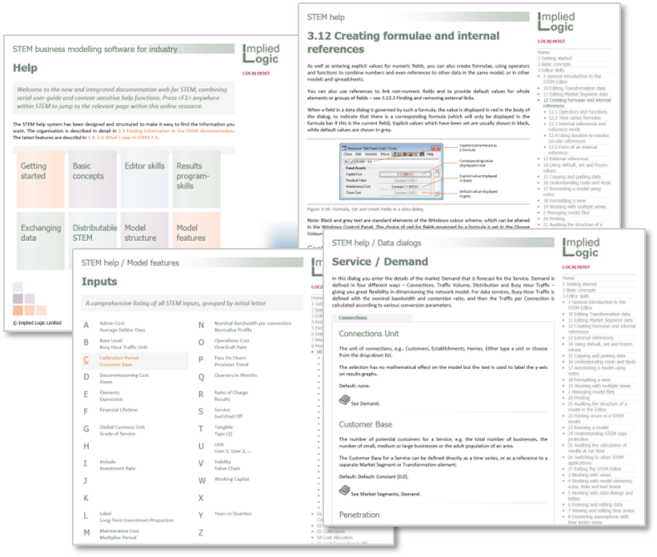
Figure 4: A selection of pages from the new, integrated help system
Option to hide scenarios
The integrated multi-dimensional scenario manager is a defining attribute of the STEM software, but inevitably with power comes complexity as STEM offers every possible combination of the Variants within each Dimension element to run as a scenario. In some cases this is useful, and there is nothing intrinsic about a particular combination to say that it is interesting or not. However, it is often the case that you may only wish to ‘slice’ the scenarios a few ways for graphing purposes (varying only one dimension on a particular chart) and some of the available combinations may be surplus to requirements. The more dimensions you have, typically the greater the proportion of unwanted combinations, and the list can become cumbersome to manage.
Therefore we have added an option to hide selected scenarios in the Scenarios and Sensitivities dialog, together with the option to show all (in order to unhide).
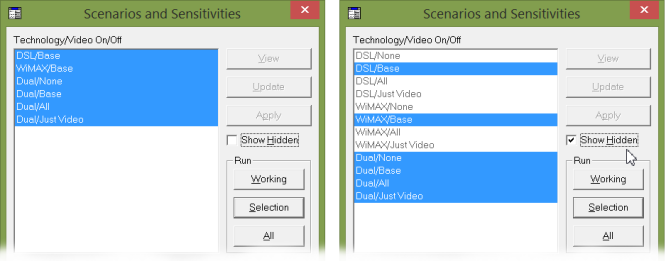
Figure 5: Favourite scenarios and the option to show hidden scenarios
Note: the ‘internal’ scenario numbers are now suppressed by default but we have also added an option to reveal these if you prefer.
Tooltips for long dialog captions
The caption for a data dialog identifies to which element it belongs, and then specifically which dialog it is; e.g., Service "Service 1"/Demand. A time-series dialog adds the relevant field name and time-series type to this caption, and soon the caption is too long for the available space; e.g., Service "Service 1"/Demand/Connections/Customer Base/Constant. This can be very frustrating if STEM has brought up a data dialog to illustrate an error message and you can’t easily identify what you are looking at!
Naturally one hovers the mouse over the caption to see a tooltip but, for reasons unknown to us, this small but vital element of Windows functionality quietly went away with the introduction of Vista and subsequent versions of Windows. Hence we have simply re-instated it by implementing our own solution, which should remove this frustration.

Figure 6: Over-long data-dialog caption clarified by tooltip
Discount Rate in the Editor
A Discount Rate input has been added to the Financial Data dialog in the Editor; this is now linked through to the result of the same name in default.cnf which is used as the basis for the standard Net Present Value result. This means that you can more readily arrange for the Discount Rate to be adjusted to the specific risk context of a model.
Note: you can readily overwrite the result definition with a simple constant if you want to be able to define a single Discount Rate directly in the results program as before.
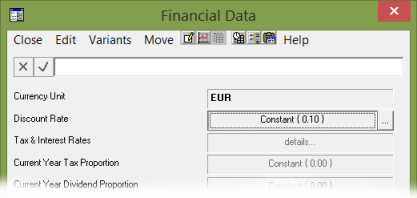
Figure 7: New Discount Rate input in the Financial Data dialog
2. Calculations
This is a broad heading which covers everything from user-defined formulae in the Editor through to the myriad functionalities of the model engine and the pre-defined and extensible set of results definitions for the results program.
New Straight Line time-series type
The familiar Interpolated Series type is extremely flexible, but its individual periods and values cannot be linked to other inputs at present, and so a series cannot be adapted to a dynamic modelling context.
Therefore we have added a new Straight Line parameterisation which implements a simple linear growth. The formulation is analogous to the Exponential Growth type, but it has a period Increment in place of the period Multiplier, together with an Increment Period to qualify the rate of growth, and a Constrain option to avoid negative values according to the sign of the Increment.
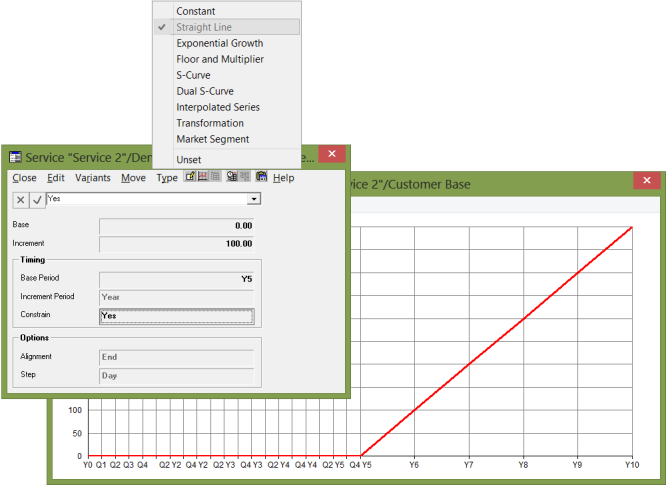
Figure 8: Time-series Type menu, Straight Line dialog and associated graph
Previous transformation type
The existing Time Lag transformation was added to STEM in the days when models could only run in years and has been used most commonly to drive ‘difference relations’ or to avoid circularities. When shorter time periods were introduced, it was clear that the Lag input (years) should be respected, and so the output always looks back the n years and skips any intermediate months or quarters. However, this offers no way to refer to an immediately preceding sub-annual period which could be used safely for a difference relation.
The new Previous transformation fills this vacuum by consistently referring to the immediately preceding period, however recent. The optional Costs input is used to avoid circular cost-allocation, just as it is for the Time Lag transformation.
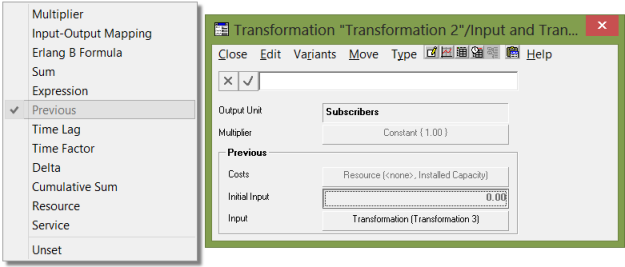
Figure 9: Transformation Type menu and Previous transformation dialog
Delta and Cumulative Sum transformation types
STEM version 7.3 introduced the new instantaneous / aggregate model for the output of a transformation:
- connections, busy-hour traffic; installed units/capacity, utilisation
- new connections, traffic, revenue; incremental units, consumption.
An Expression transformation will classify its output as aggregate if any one input is aggregate, but two special cases demand better implicit recognition:
- the delta (or forward difference) between the value of an instantaneous input now and its previous value should be treated as aggregate
- the cumulative sum of an aggregate input should be treated as instantaneous.
So we have added new Delta and Cumulative Sum transformations as follows:
- a Delta transformation requires an instantaneous input and calculates the forward difference between the value of the input now and its previous value. It has an optional Initial Input value and its Output is classified as aggregate
- a Cumulative Sum transformation requires an aggregate input and calculates the cumulative sum of the input up to the current period. Its Output is classified as instantaneous.

Figure 10: Delta and Cumulative Sum transformation dialogs
Evidently the Delta and Cumulative Sum are mutually inverse transformations.
Cumulative capex (and other results) in standard default.cnf
By popular request, we have also added a number of cumulative results to the standard results configuration as follows:
-
Cumulative Capital Expenditure
-
Cumulative Operating Costs
-
Cumulative Operating Charge
-
Cumulative Traffic
-
Cumulative Revenue
-
Cumulative Operating Profit.
New Deploy With Utilisation and Minimum Slack inputs
New Deploy With Utilisation and Minimum Slack Capacity inputs have been added to the model for resource deployment. The first option confirms that, from STEM 7.4 onwards, the existing Maximum Utilisation constraint for a resource will be applied at the site level by default when used in conjunction with Deployment. (Our training course has made it clear that historically this was not the case and older models loaded into STEM 7.4 will set Deploy With Utilisation = No for all resources for backwards compatibility.) The difference is only significant in specific cases and we will be pleased to help you understand this new refinement to our calculations.
In addition, the Minimum Slack Capacity input provides an alternative way to supplement the installation of a resource. The Maximum Utilisation constraint reserves an overhead of spare capacity across all units, whereas the Minimum Slack Capacity input simply reserves capacity in the last unit for additional demand at short notice.

Figure 11: New Minimum Slack Capacity and Deploy With Utilisation inputs
Calculating economic depreciation for regulatory accounts (LRIC)
Finally, and with no change to the underlying platform, we have established a consistent framework for calculating economic depreciation results for use in regulatory accounts and long-run incremental cost (LRIC) models. This is described in more detail in a separate article.
3. Results program
Per graph consolidation
Again by popular request, it is now possible to control consolidation (the reporting up from monthly or quarterly results to annual) on a per-graph basis, so that you can choose to provide a high-level annual summary in some graphs while providing more detail in others as required.
This is one example of a range of graph settings which can now be controlled at the individual graph, whole view or entire workspace level. The new Graph Format dialog will significantly streamline how you control the appearance of your results in STEM.
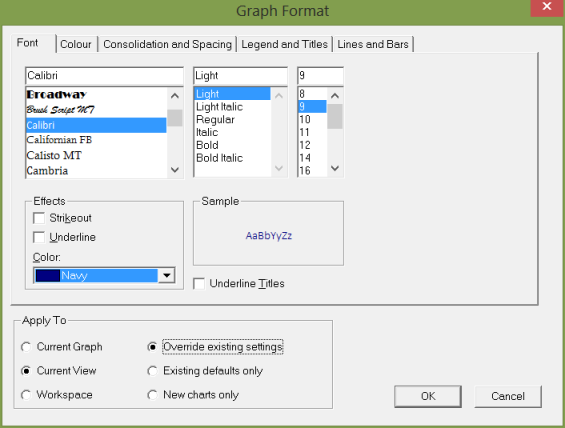
Figure 12: New Graph Format dialog
Smart tick-marks for sub-annual periods
Previously the charting engine in STEM has done its best to show as many period labels as will fit against the category axis. This worked quite well when the results were just in years, but left a lot to be desired with quarterly or monthly results where you might find only the fifth or sixth period label would be visible. STEM 7.4 takes a much smarter approach: it only ever labels the years on charts and uses smaller minor tick-marks and dotted grid-lines to demark any sub-annual periods.
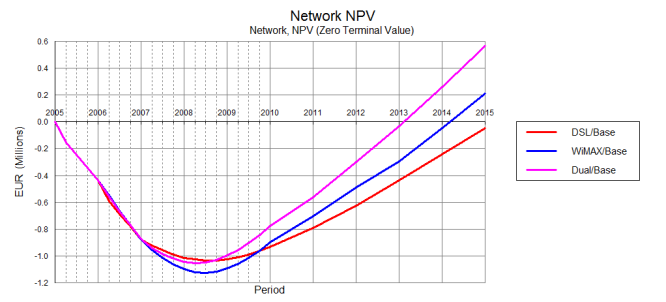
Figure 13: Sub-annual periods implied by dotted grid lines
User-definable colour palettes and options to suppress Y0
Finally it is possible to define your own colour palette(s) for graphs in STEM, again at the level of an individual graph, a whole view or the entire workspace. All of these settings, and options to suppress Y0 (on column and/or line charts), are controlled in the new Graph Format dialog.
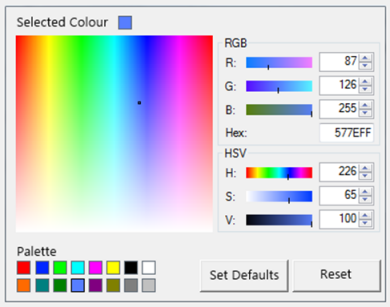
Figure 14: Mock-up of the colour picker for new Graph Format dialog
Optional smoothed lines
One further addition is an option for smoothed lines on line charts. Unlike the other new additions, this is presented as a distinct graph type in the Graph Type dialog.
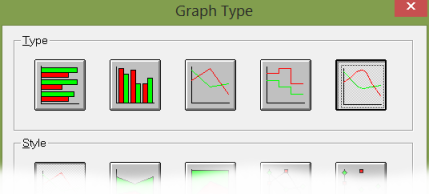
Figure 15: New Smoothed Line option in the Graph Type dialog
4. External interfaces
Export results to native .xlsm format for Excel
The majority of STEM users routinely connect their models with STEM, linking key assumptions from Excel, and then linking results in as much detail as required through to Excel with the help of the STEM add-in for Excel. Previous versions of STEM will export to the older .xls file format by default, whereas this play-safe approach is removed in STEM 7.4. This has also helped us develop a solution to the annoying problem of the required Visual Basic reference being discarded by Excel 2007/2010 when it saves a file unless you paste in a suitable dummy macro to inhibit this behaviour.
Exporting input data to link back from a database
STEM has also for many years supported input links from any database supporting the Open Database Connectivity standard (ODBC). The approach is similar to working with Excel, in that a relevant database query is expected to return (conceptually) a series of labels and associated ‘values’.
This was fully-documented within STEM, but rarely used in practice due to the relative inflexibility compared to Excel (as time-series values must be coordinated across multiple rows in a database). Consequently there was no demand for an export function to pre-populate such a database.
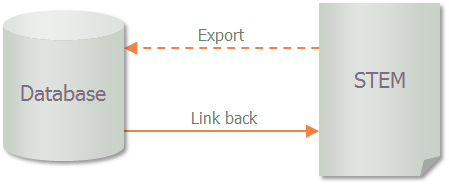
Figure 16: Export model data and then link back from a database
Excel has never been an ideal data repository in a team environment, and now industry demands greater scrutiny of, and less reliance on, Excel for handling commercially-sensitive data and calculations. So there is renewed interest in the database alternative for linking assumptions into STEM, and we have developed an export function, in consultation with existing clients, comparable to the existing export to Excel. Now you can select an existing ODBC data-source from within the usual Export Model Data dialog.
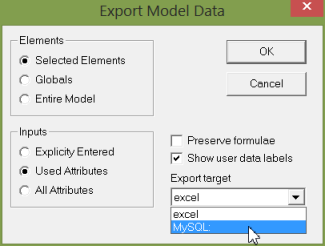
Figure 17: Option to select an ODBC data-source when exporting model data
Note: if a database is too volatile, then it may still be preferable to interface via Excel to control the timing of external updates, as well as for version-control purposes.
Export results to ODBC
For completeness, STEM 7.4 also supports the ability to export results to a database. Just like the input side, now you can also select an existing ODBC data-source from within the usual Export Results dialog.
Note: You will note that we have taken the opportunity to simplify this dialog by removing some of the original, rather superfluous options.
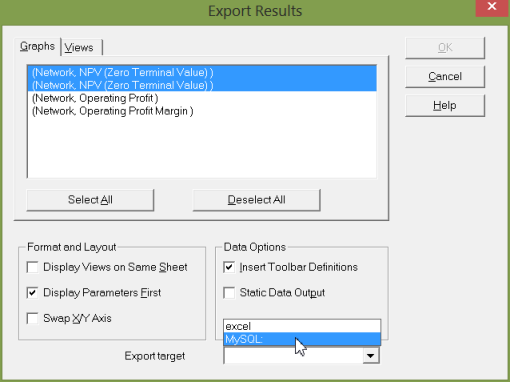
Figure 18: Simplified options and option to select an ODBC data-source when exporting results
Tornado charts on the web, and in Excel
Last, but certainly not least, STEM 7.4 addresses a previous omission in that it is now possible to include a tornado chart in an eSTEM online presentation for the web. The required architectural additions mean that it is also now possible to export tornado data to Excel and we even provide macro support for drawing tornado charts in Excel.
The existing StemGetResult() syntax has been extended to include optional period, sensitivity, parameter and step arguments which enable the reproduction of the full range of STEM outputs in Excel, as well as on the web. To match this, the scope of the Scenarios to Run cell in the STEM toolbar definitions sheet has also been extended to support the addition of required sensitivities for individual or groups of scenarios, and a Paste Sensitivities button has been added to the latest add-in toolbar.
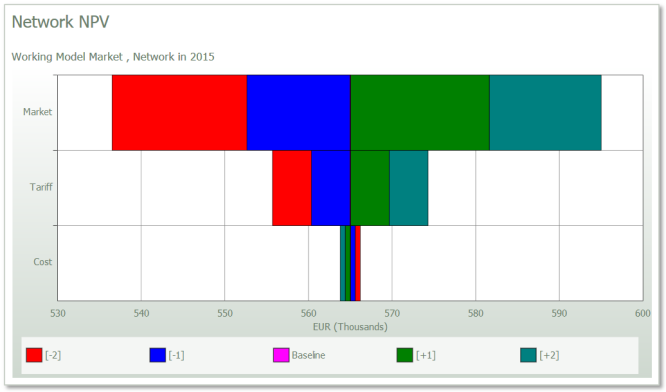
Figure 19: A tornado chart within the HTML 5 generated for the web by eSTEM
5. Final summary
As you can see, STEM 7.4 contains a whole host of new features, balancing usability and fresh new modelling angles. We hope our beta testers will enjoy experimenting with the new system and look forward to your feedback!