Suppose it were easier to connect results with what you can see in the
Editor, or that STEM could anticipate which results would be of most immediate
interest.
Like any software modelling tool, STEM is great when it does what you want: it saves
time, enforces consistency, and avoids stupid errors. However, it can be frustrating
if it doesn’t behave as expected/required. Not only should
you trace routinely through the relevant results for each element to verify that
all is as intended, sometimes you have to do this
if you can’t figure out why the results are the way that they are!
 It doesn’t help that you have to switch to the separate Results program,
and then locate the relevant elements all over again in the graph-drawing interface
(however nice the new interface is). You even have to think about which results
are most relevant. While both aspects of this process become second nature to an
experienced modeller, we should not overlook the number of mental leaps required
here, especially for the uninitiated.
It doesn’t help that you have to switch to the separate Results program,
and then locate the relevant elements all over again in the graph-drawing interface
(however nice the new interface is). You even have to think about which results
are most relevant. While both aspects of this process become second nature to an
experienced modeller, we should not overlook the number of mental leaps required
here, especially for the uninitiated.
Fast track to results in the Editor
We are now developing the capability to display results directly in the Editor.
Rather than switching to a separate window and then re-locating the relevant elements
in a list, you will be able to draw results charts directly from the context menu
for an icon, or for a multiple selection of elements, in the Editor.
- Right-click one of the icons to select the context menu, and then look for a new
cascading sub-menu called Results. The sub-menu
offers all of the Essential results which are available
for the selected elements (even with a variety of element types).
- Select one of these results. A single new graph is drawn immediately below showing
the selected result for each of the selected elements.
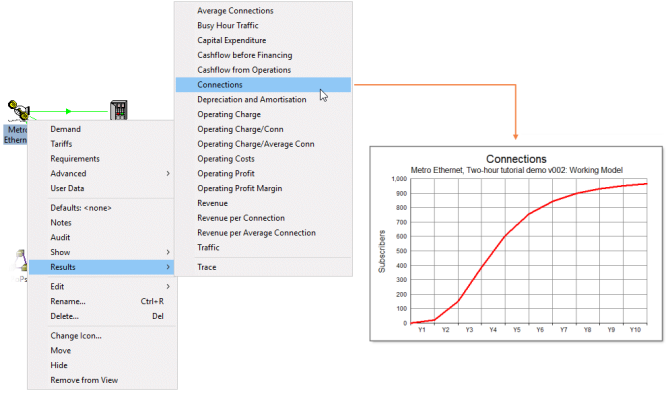
Figure 1: Graphing an essential result directly from an element in the Editor
The graph is created as an entity within the current view which can be moved around
or resized, just like a textbox. It will be selected when first drawn so that it
can be readily discarded (by pressing <Del>) if you only want to review the
results temporarily.
A graph drawn this way will show the most recently-run scenarios by default, or
possibly the same scenarios as selected most recently for another chart. We may
make it so that these scenarios are sliced (from
a dropdown on the chart) if more than one element is selected and thus represented
on the chart.
You can then modify the graph format in situ by
right-clicking the graph as you do in the current Results program, or change the
selection of elements, results or scenarios by right-clicking the title or legend
items as appropriate. The Editor will prompt to re-run any extra scenarios which
are currently out-of-date.
The more familiar Draw commands will also be available
from a new Results dropdown on the main menu-bar
if you prefer to specify everything in advance. We might also add a
Select Results option to the context menu which would jump from the iconic
selection of elements to the next tab in the regular graph
Draw dialog.
Results graphs and tables can be placed alongside the relevant icons, or in separate
views if you prefer, and they will scale together with the icons when you change
the Zoom level. As a selectable item in its own
right, a graph can be readily copied. This offers a potentially more intuitive alternative
to the current Draw Similar command (for cloning
a graph) and also makes it easy to duplicate a whole selection of graphs in another
view.
Note: we could add a Cut command to make it easier just to move a selection from
one view to another by automatically removing the original items after they are
pasted.
All of these actions, from drawing a graph to modifying it
in situ, or moving or sizing it within or between views, will be reversible
with the general Undo system in the Editor.
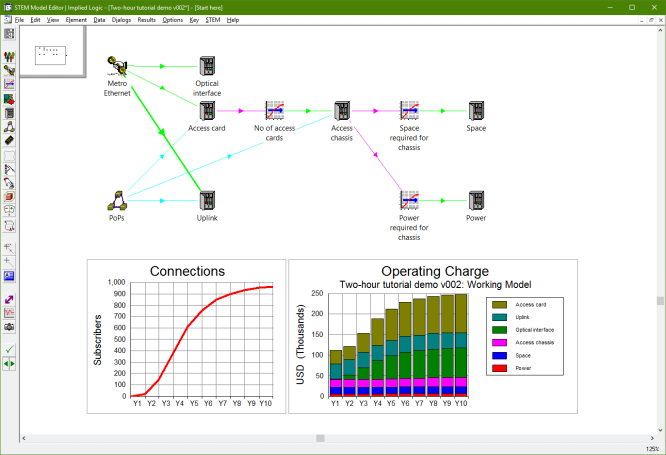
Figure 2: Specimen hybrid input and results view
The Editor will load an existing results workspace, and it will still be possible
to include the results of other models if so desired. All the usual results options
will be accessed from the existing Options menu
in the Editor. The long-term aim is to retire the separate Results program altogether,
though it is likely that we will retain it at least long enough for people to become
familiar with the new interface and embrace it rather than being forced to adopt
it involuntarily!
This integration of functionality from the current two separate programs will be
a defining feature of the forthcoming STEM version 8.0.
Graphs that you might like to draw
The most important results graphs are now just a few clicks from the relevant model
elements in the Editor. It’s a bit like the immediacy of shopping on Amazon or surfing on YouTube…
except that they make it even easier by anticipating what you might want to buy
or watch next.
Suppose that STEM could also guess which results would be of the most immediate
interest? Considering the usual advice from training about tracing routinely through
the relevant results for each element, it is easy enough to determine which results
are most pertinent to the flow of calculation in terms of the underlying drivers.
Experienced modellers have checked these results, laboriously, for years; and now
we are going to make it so much easier with a simple
command that must be seen to be believed!
So far we have been focused on accessing results for individual elements, whereas
most of the significant calculations in STEM arise from the connections
between elements. Imagine (as follows) that you could also look for results
on the menu for a connection between two elements, or on the icon menu for a selection
of connected elements, or even for two distant elements where an indirect connection
exists or is suspected.
- Right-click a connection between two icons and then select
Trace Results from the context menu. STEM automatically draws the most pertinent
graph for each element based on the nature of the connection between them (e.g.,
service Connections and resource
Capacities for a requirement link). The two graphs thus created appear
side-by-side below the elements.
- Right-click a multiple-selection of icons (at least two) and then select Trace from the Results
cascading context submenu mentioned above. STEM more generally graphs the ‘input
and output’ of each direct connection within the selection, skipping the input
for intermediate elements where this is the same result as already graphed as the
output for a preceding connection.
- Select exactly two icons and then select Trace
from the Results cascading submenu. STEM more extensively
and helpfully identifies any direct or indirect connection between the two elements
(which could be obscured across multiple views), and again charts all of the intermediate
drivers as well as the initial assumption and final result.

Figure 3: Tracing the flow of calculation for a single connection or between multiple elements
Which results would you check when a service has a requirement for [capacity from]
a resource? Which results would you check when a location controls the deployment
of a resource? And which results would you check when a resource is an input to
a transformation?
One always checks more or less the same charts, depending on the exact relationship
between the various connected elements. Usually one pertinent result ‘from
each side’ will be sufficient to illustrate the calculation flow as detailed
in Figure 4 below.
|
Connection
|
Result to graph
|
|
Service or transformation requirement for resource
|
Service connections or whatever according to Basis,
or whichever transformation output is defined (i.e., instantaneous output or aggregate
count); and then pre-defined resource capacities graph
|
|
Service or transformation requirement for function
|
Service connections or whatever according to Basis,
or whichever transformation output is defined; and then pre-defined function capacities
graph
|
|
Input into transformation
|
Service or resource result according to input Basis;
and then whichever transformation output is defined
|
|
Transformation input to service
|
Whichever transformation output is defined; then service connections if driven by
Customer Base or Penetration,
or traffic if driven by Traffic per Connection,
or busy-hour traffic if driven by Nominal Bandwidth
|
|
Transformation input to resource
|
Whichever transformation output is defined; then pre-defined resource capacities
graph if driven by either Sites or
Planned Units
|
|
Transformation input to market segment or location
|
Whichever transformation output is defined; then market segment size or location
sites
|
|
Transformation input to another transformation
|
Whichever transformation output is defined for each transformation (separate graphs
for consistency, and because units may be different)
|
|
Market segment to service
|
Market segment size; and then service connections
|
|
Location to resource or function
|
Location sites; and then pre-defined resource or function capacities graph
|
|
Variant to dimension or template
|
Disregard as too much information in general
|
|
Dimension or template to parameter reference
|
Corresponding variant data (single graph); and then the working model value (separate
graph)
|
|
Sensitivity to parameter reference
|
Disregard as nothing useful to display (as the impact of a sensitivity is not stored
anywhere in the Editor)
|
|
Formula link from reference to subject
|
As a fall-back, if none of the above apply, we could consider showing the input
referenced in a formula; and then the input controlled by that formula
|
Figure 4: Connections between elements and the corresponding results to graph when
tracing
If more than two graphs are created, then they are cascaded for compactness, and
can be easily stepped through by clicking the corners. At first the newly-created
graphs will all be selected and therefore easy to delete. Stepping through the individual
graphs will lose the selection, but it will still be possible to press <Del>
repeatedly to discard them, one at a time, as the focus is always passed to the
most recently-selected item when the current item in a view is deleted.
Making STEM more immediate and intuitive to use
Now we can literally trace the flow of calculations in a model. You no longer need
to switch to a different window and re-locate the relevant elements in a list, and
now STEM will even do all of the routine checking for you! Removing
mental leaps such as these is a central design objective for the forthcoming
STEM version 8.0.