A specimen business with a market value of EUR100m p.a. could be run
on just 29 shopping servers and 13 checkout servers.
 With the possible exception of the local convenience store, every other retailer, from small specialist store through to supermarket, has to consider the extended reach of the Internet when defining its commercial strategy. Particularly with the emergence of the Shopping Platform as a Service (SPaaS) player, there is really no excuse for a retailer not to be online, and happily very few barriers to being so.
As a modelling exercise for the STEM User Group Meeting in October 2014, we explored the economics of an online retailer, from the front end of a fully-featured web store right through to the internal supply management and required back-office functions. In the limited time available we:
- de-constructed the myriad functions of a combined online retailer and SPaaS player
- compared the different business models and stock/warehouse management issues between own products and third-party sellers (or fulfilment)
- considered a suitable dimensioning model for the front-end web presence.
The result was a business template for a specific niche product type, incorporating
relatively few assumptions, which could be further extended and refined, and then
replicated systematically for other product types to form a highly detailed insight
into the economics of a major national or even global player.
1. Scope of the business and focus/approach for the exercise
If you consider the elements of an online marketplace, really very many activities sit behind the streamlined interface which is presented to customers (much as the sourcing of goods and supply management is behind the scenes in a conventional store).
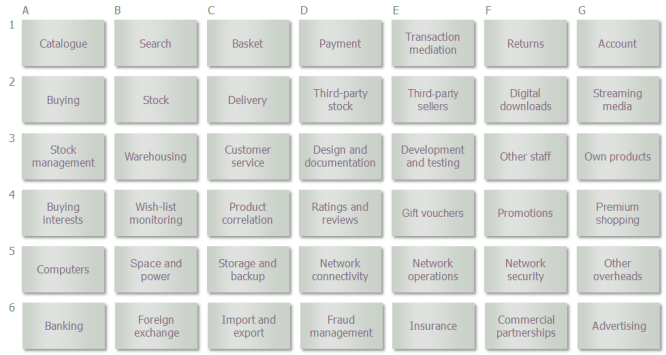
Figure 1: The elements of an online marketplace
For the sake of the interactive exercise, and to focus on the essential details of what is interesting and different about this context, we may choose to skip the non-critical and fiddly details (which are not core to the business model), as well as the routine telco aspects (which we have examined in many other contexts, including the value chain for a cloud email provider).
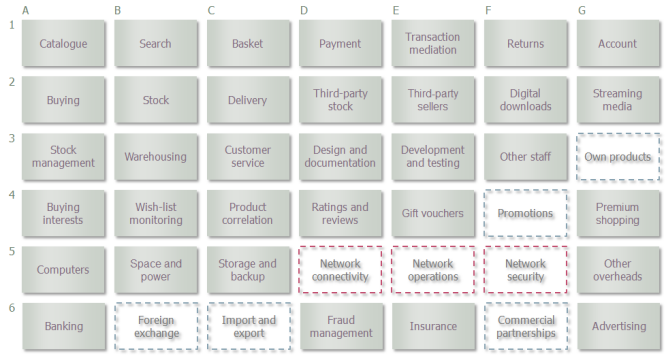
Figure 2: Skipping the non-critical and fiddly details, as well as the routine telco aspects
In order to develop a rigorous and well-structured business model, it is generally better to focus on smaller, functional groups in turn, each of which may be considered very effectively in isolation without the distraction and overload of doing everything at once.
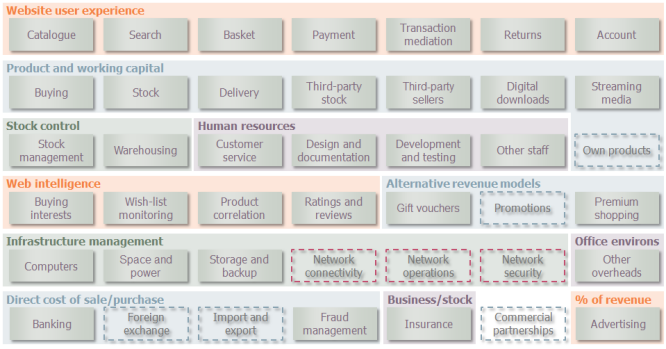
Figure 3: Focusing on smaller, functional groups in turn
From the perspective of money-in/money-out, we can then consider the specific services and resources of this system, as well as the corresponding drivers.
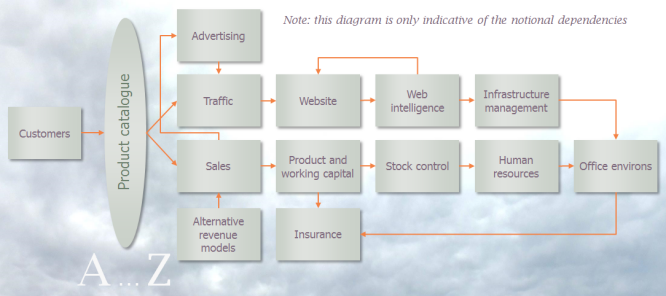
Figure 4: A first, rough cut of the likely model structure
2. How to think about the market
It would be tempting (easy, and also different) to start from an annual market potential (EUR value), split between various categories of products (value, and seller model; e.g., own stock, third-party stock, third-party seller, or whatever). However, a critical factor is likely to be that website traffic is roughly proportional to distinct items per user (i.e., the shopping process itself, and not even the quantity), and certainly not related to revenue in any sense. This means that:
- small items carry a high website overhead-cost per dollar; but also that
- such items carry a high onward-marketing opportunity per dollar.
Therefore, any formulation of the demand for the online retailer’s products should make some assumptions about the buying characteristics of the user base, split first by product category, and then by:
- actual sales volume
- average quantities per transaction (where applicable)
- repeat purchase rates (where applicable).
At first sight, the required categorisation of products would seem to be around seller model / value / typical quantities and repeat purchase rate. However, many products are actually available from a variety of sellers and seller types, and so it would be better for a product category to specify a more flexible seller-type mix rather than pigeonhole a product exclusively with one kind of seller or another.
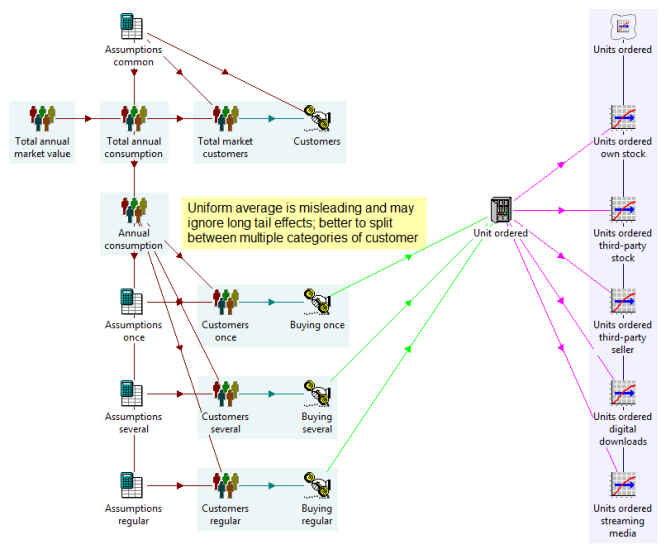
Figure 5: Market and service structure of the STEM model
3. Critical business drivers
The set of defined drivers available to the model should include at least revenue, product volume, shopping time, and check-out time. One interesting aspect for this exercise is that these are all aggregate measures. The volume will drive matching consumable product-category resources, of which the online retailer should maintain suitable stocks to cater for peaks in demand. The actual cashflow impact of this and associated warehousing and delivery costs will vary significantly according to the seller model.
This is the commercial heart of the model, but we should at least consider the costs and potential hidden benefits of the website user experience too. We can probably model the online store elements at a high level in terms of:
- server capacity for simultaneous processing, or
- server capacity for concurrent sessions.
These elements will in turn drive requirements for supporting items such as:
- server infrastructure, including connectivity, storage and backup
- human resources to develop, maintain and operate the site
- direct costs of sale, such as banking fees; and overheads, such as insurance.
A key metric to calculate and use as an external sanity check is the number of servers required to be brought up and connected during busy periods, assuming that an on-demand compute solution is being used. These resources are persistent, but the charging should reflect the ‘base plus on-demand’ nature of the real-life implementation.
Note: we will exclude the possibility that the provider might actually own the on-demand compute solution too because this is a different business model and, in any case, very similar to last year’s hosted email comparison.
On the strength of the above, we formed the following outline for the manageable scope of a model which could be worked through in a period of three hours or so.
- Market value and average price (per product category)
- Average quantity per transaction and transactions per year
- Worry about misleading averages: separate occasional/regular buyers
- Assorted buying characteristics underpin the total units ordered
- Split into own stock, third-party stock, and third-party sellers
- Add template and variants for nine specific product categories
- Stock overhead for own stock based on days’ or weeks’ orders and actual stock in warehouse
|
|
- Storage bays needed, driving stock management and warehouse staff
- BH Erlangs from shopping minutes (per customer p.a.) and checkout minutes (per transaction) drives:
- processing Erlangs (duty cycle)
- session Erlangs (considering active minutes and session time-out)
- Assume peaks can be absorbed by delayed response (no queuing model or Erlang transformation)
- Dimension shopping and checkout servers by limiting capacities:
- simultaneous processing
- concurrent sessions
|
Figure 6: Shopping list of model elements and considerations for an initial three-hour workshop
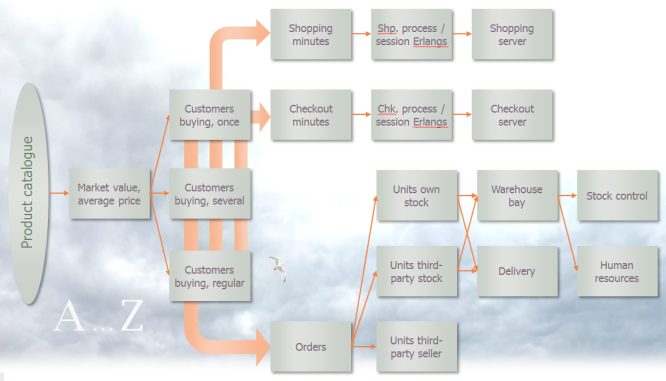
Figure 7: A more specific and achievable model outline
4. Different business models and stock management
The internal commercial model for selling the retailer’s own stock is directly comparable to a conventional retailer. The mark-up must cover the working-capital implications of a given maintained level of stock, in addition to the direct costs of the warehouse space itself and the actual delivery of orders to customers, as well as a stock control system and the staff required to man the warehouse(s).
The same considerations apply to third-party (fulfilled) stock, but without the cashflow aspect, whereas none of these overheads apply to third-party sellers. Consequently, there will be a smaller margin on third-party (fulfilled) stock and only a small sales commission on orders taken for third-party sellers.
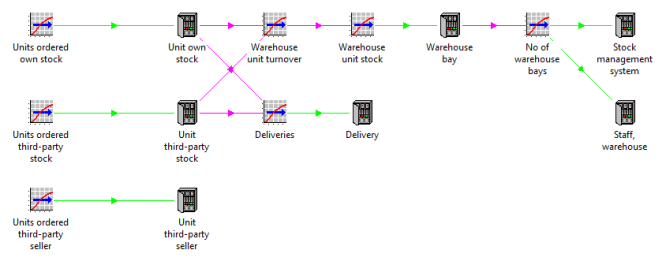
Figure 8: Different business models in an online marketplace
5. Dimensioning the web presence
By making some assumptions about the typical time a customer spends first browsing for a product and then checking out (shopping minutes and checkout minutes), we can use the standard volume-driven traffic formulation in STEM to estimate the number of concurrent customers using the site during the busiest periods. By factoring in further assumptions for the average duty cycle during each of these processes, this can be converted into concurrent processes on the server side.
If an average shopping session lasts 15 minutes, then one shopping Erlang will start four separate sessions; but if the server maintains a session time-out of 20 minutes, then the first session will actually overlap with the next and the next. So, there will be (15 + 20) / 15 ≈ 2.33 session Erlangs per shopping Erlang. This is more extreme for the checkout process if the average checkout time is only two minutes. With the same session time-out, there will be (2 + 20) / 2 = 11 session Erlangs per checkout Erlang.
Note: this overhead would not arise if sessions were terminated on successful completion of the shopping and checkout processes, but this is not thought to be a common design practice for typical web applications.
These calculations can be made in parallel for each customer type in order to estimate the maximum load on the respective servers.
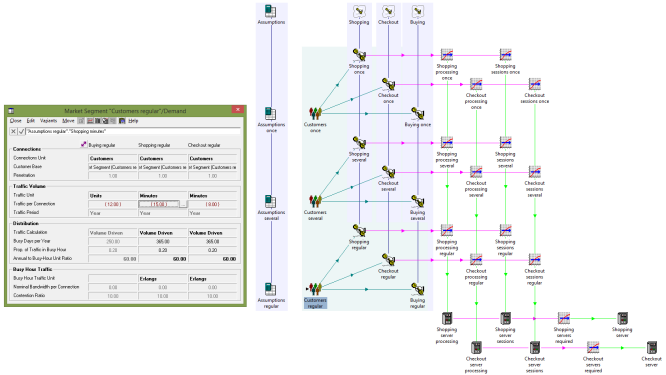
Figure 9: Dimensioning the web presence in terms of concurrent processing and sessions
Of course, assumptions are required at every turn of such a model and this is where much of the real work and dedication in business modelling lies. For completeness, the full set of assumptions we worked with are presented in Figure 10 below. Happily it is not necessary to review all of them in order to understand how the model works!
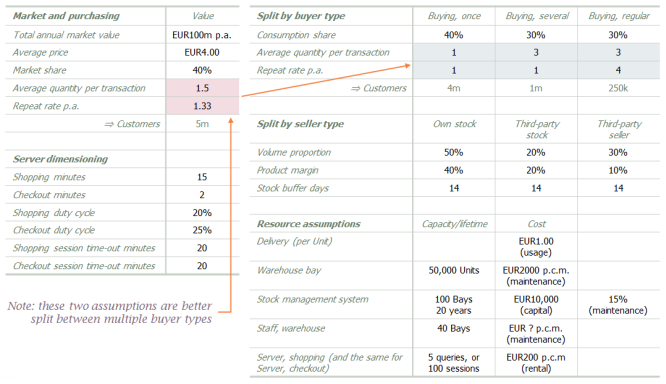
Figure 10: Provisional assumptions for the business model
The charts below show the progression of this calculation from numbers of customers (by customer type) through to shopping/checkout minutes and process/session Erlangs, from which in turn the number of required servers is inferred. On the strength of these collective assumptions, our specimen business with a nominal market value of EUR100m p.a. could be run on just 29 shopping servers and 13 checkout servers.
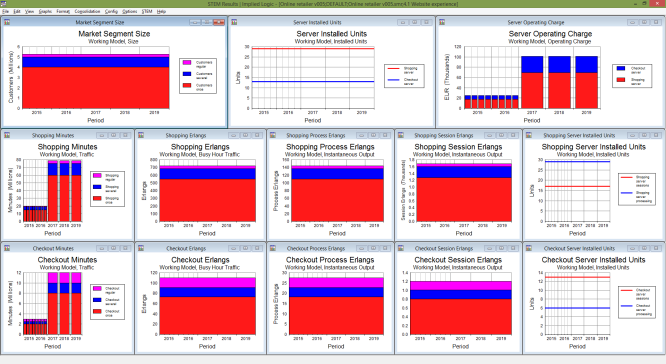
Figure 11: Results (by customer type) for shopping/checkout minutes and process/session Erlangs
6. Compact online model
In order to make this model more accessible, we have published an interactive version
online (using the new Compact option available in STEM 7.4). The charts in Figure 12 below are live and will update if
you modify any of the assumptions on the left and then click the Run Model button.
Figure 12: Test your own assumptions with our compact online model
7. Aggregation across multiple product categories
All of the details considered so far relate to a single product category corresponding
to a specialist retailer or marketplace. To extend this scope to the full operational
gambit intended, it is necessary to replicate this structure for multiple product
categories with varying market potential and shopping characteristics as suggested
by Figure 13 below.
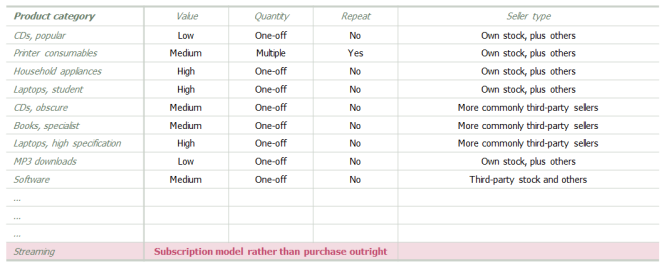
Figure 13: Indicative list of product categories
STEM enables a compact model of the most complex systems
This is exactly the kind of model complexity for which STEM was created and this is a textbook application of the standard template replication feature (the details of which are beyond the scope of this article). If you are responsible for a global online market place, you might want to look into our approach in more detail as we could help you develop a really effective costing and planning model for your future business evolution!