STEM models can now
be accessed from PC, Mac, iPad, iPhone, Android and Windows Phone platforms.
 Since we last covered the developing eSTEM web capability in October 2011, our clients
have been developing their respective web presences very energetically. Their input
has driven our own development forward and we are now generating native HTML 5 interfaces
in preference to Flash to achieve wider device compatibility.
Since we last covered the developing eSTEM web capability in October 2011, our clients
have been developing their respective web presences very energetically. Their input
has driven our own development forward and we are now generating native HTML 5 interfaces
in preference to Flash to achieve wider device compatibility.
Our generated HTML is not (yet) pretty, but it is immediate and fantastically
more reliable than anything else compiled by hand. The automation and ease of use
is such that one recent newcomer to the web environment for STEM had a first model
up and running on the web within 24 hours.
A separate User Guide for Enterprise STEM is being
updated on a frequent basis while this functionality remains in significant flux.
The June 2012 edition includes explicit set-up
instructions for the website and associated software stack as well as all of the
latest functionality. Here we describe the process of generating HTML 5 interfaces
from the Editor and Results programs through to publishing these on the server.
We also provide an update on new features such as usage tracking and options for
users to save their own input sets and download template reports.
1. The process for publishing a model with eSTEM
After creating a model in the STEM Editor and results views in the STEM Results
Program, a user can choose to export selected input values in the model and particular
graphs/tables or results views to a web interface as described in the following
pages. A set of data and configuration files for the eSTEM server will be generated,
as well as the web interface that will access the web service to run this particular
exported model and display the results chosen by the modeller.
The recommended approach is to use a sensitivity element to gather together (and
group and order) the desired inputs from multiple elements, exactly as if you were
going to run a sensitivity analysis for those inputs. The
Label field for a regular sensitivity parameter can be used to customise
the labelling of the corresponding web controls, and a new
Web Presentation dialog for the sensitivity element offers the following
fields per parameter in order to govern more prescriptively the placement and style
of the various web controls within a single tab (i.e., all visible on one page with
scroll bars if required).
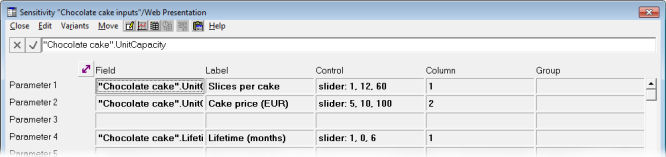
Figure 1: The new Web Presentation dialog for a sensitivity element
If there is too much information to fit onto ‘a single screen’ and you
are not keen on the use of scrollbars, then it is also possible to create a ‘tabbed’
interface. If you select a number of separate and distinctly named sensitivity elements
as described above, then each sensitivity element will define an individual tab
in the web interface, and the tabs will be presented in the same order as they appear
in the Editor, working from left to right and then down the selection.
Alternatively you can control the order more robustly by including each of the sensitivity
elements within a collection, and then just selecting the collection prior to the
export.
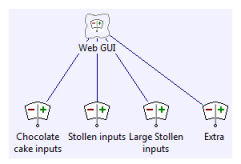
Figure 2: Controlling the tab order with a collection of sensitivity elements
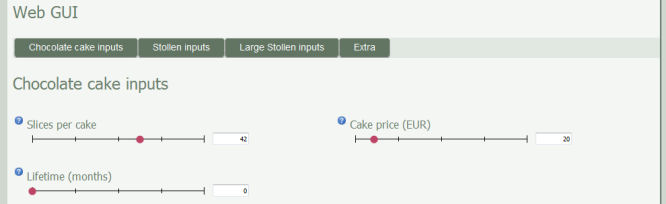
Figure 3: The corresponding multiple tabs in the generated web interface
You can even create a hierarchy of nested tabs by creating a collection of such
collections of sensitivity elements!
An equivalent function in the Results Program enables you to add charts and tables
to a web presentation in a very similar manner to exporting results to Excel.
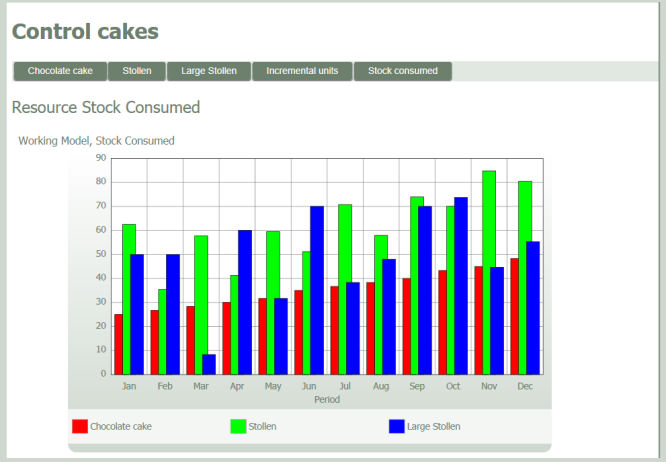
Figure 4: Sample results output in the generated web interface
This chart is part of a 100%-generated web presentation created in minutes based
on our recent newsletter article about cake consumption.
2. Controlling activity logging and debug output
The web service is designed to log all activity, you simply have to enable the functionality
as follows and decide how much detail you want to see.
For each individual model, you can define a logging
attribute within its associated WebServiceModelConfig.txt
file with possible values as shown in Figure 5 below.
|
Attribute and value
|
Effect
|
|
logging = none
|
No log files are created (the default).
|
|
logging = transaction
|
One line is appended to the log file for each external request handled by the web
service, listing the time and date, the user and the type of transaction.
|
|
logging = input
|
In addition to the transaction detail, one further line is appended to the log file
for each input value sent for each run, save or export command, listing the time
and date, the user, the relevant input reference and the value set for that input.
|
|
logging = debug
|
In addition to the transaction and input details, further detail is appended to
the per-transaction output including the length of time taken to process the request,
the value of each result returned to the user (where appropriate), and any additional
information which may be required to profile or diagnose any problems with the service
from time to time.
|
Figure 5: Individual model logging options for the eSTEM web service
3. Enabling per-model defaults and per-user saved model inputs
The HTML interface code generated by the STEM Model Editor incorporates commands
(which utilise corresponding web-service methods) for the end-user:
- to save (and name) their current input values from the web presentation, and
- to subsequently select and reload those values at a later date.
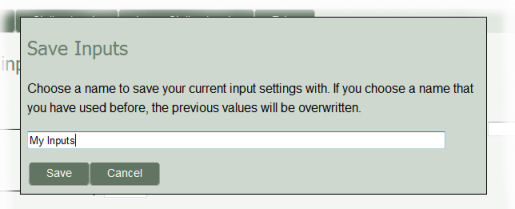
Figure 6: The Save Inputs dialog in the generated
HTML interface code
In addition, the user may choose:
- to restore the original default values for the model, or
- to select and load any alternative default values which may be provided by the site
administrator (for example to cater for differing user profiles).
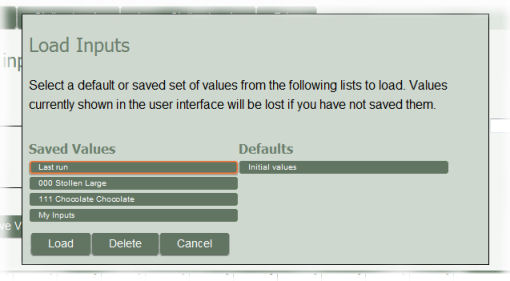
Figure 7: The Load Inputs dialog in the generated
HTML interface code
4.Creating Excel-based reports to download in XLSX or PDF format
An Excel-based report drawing on live model inputs and results can be generated
from a pre-defined template file by the web service and then made available for
download by the end-user in either XLSX or PDF format.
4.1 Using token replacement to populate an end-user download
Reports are generated by creating a copy of a template XLSX (or XLSM) file, modifying
cells within this file that are marked for some form of modification and then saving
this copy into a location from which it can be downloaded by the user. Note that
the template file must be a spreadsheet saved only in XLSX (packaged XML) format.
The template file may contain any content supported by the file format. Cells with
content matching any of the following rules will have their content replaced by
the export process. All other content in the spreadsheet will remain unaltered;
thus a report can contain whatever text, images, formatting or other media the user
chooses to place in it. Although STEM will not generate charts in the report, the
user can add charts that reference cells to be replaced as their source data, so
that charts of result data can be produced. The formatting of replaced cells will
not be altered – only the content.
4.2 Token-replacement keywords and intended usage
The following table describes each of the available token-replacement keywords and
its intended usage. If any cell has content that starts with the tag value but doesn’t
match any of the expected formats, or if a value fails to be retrieved for any reason
to fill the cell, the cell will be made empty and an explanatory message will be
logged to the configured logs folder for the web service.
|
$STEM$ input <element> <field> <period>
|
|
|
The value of the specified input when the report was generated.
|
|
$STEM$ result <scenario> <element> <result> <consolidation
mode> <period>
|
|
|
The value of the specified result in the specified scenario. To refer to the working
model, pass an empty string for the scenario name.
|
|
$STEM$ period <scenario> <consolidation mode> <period>
|
|
|
A period label for the specified scenario. To refer to the working model, pass an
empty string for the scenario name.
|
|
$STEM$ next
|
|
|
If the cell immediately to the left of this cell contains an ‘input’,
‘result’, ‘period’ or ‘next’ instruction, this
cell will be given the value or label from the subsequent period for the same input
or result if values or labels remain to be displayed. In all other cases, this format
is invalid.
|
|
$STEM$ <input or result> [ <string 1> <string 2> … ]
|
|
|
Retrieves a value using the initial instruction, but uses that value to select a
string from a list and places the selected string in the cell rather than the retrieved
value.
|
Figure 8: Token-replacement keywords for exported reports in Excel
The syntax is evidently rather intricate as it essentially embeds the same kind of information as you might be familiar with providing to the StemGetResult() and StemGetPeriod() worksheet functions in Excel after exporting results to Excel in the desktop environment.